Nutrient Load Nutrient Concentration
Wednesday, May 18, 2022 5:24 AMMethod description: Nutrient concentration along flow paths
The monitoring of the highlighted parameters in the nutrient loading pathway of change at the first two scales (miniwatershed and microwatershed) uses the same experimental design as shown in the figure below. The difference between them is related to the position of the water sample collectors. While in the plot scale the apparatus must be installed in the agricultural hillslope, in the miniwatershed scale they must be installed in the riparian zone. The figure also illustrates different apparatus for collecting water samples in different soil compartments: surface runoff parcels, soil solution and groundwater. To obtain better monitoring, it is recommended to following the criteria below:
- Apparatus must be installed along the portions of the slope where there is significant movement of material. (Determining these locations must be done a priori through modeling.) And in the transverse direction of the hillslope.
- Apparatus must be installed at least in duplicate in each portion.
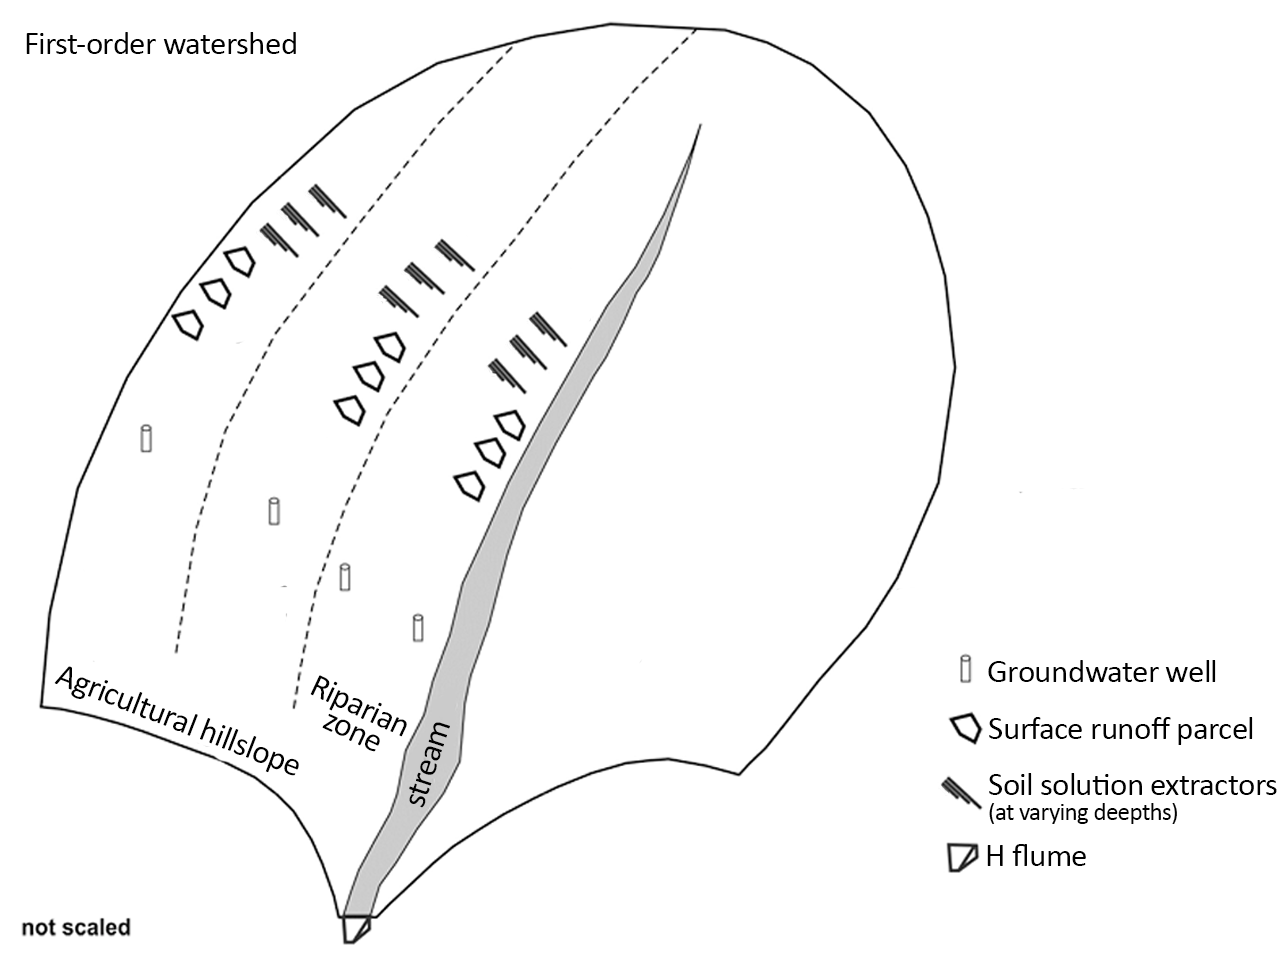
Figure 1 Illustration for an experimental design in an agricultural hillslope. Example depicts field apparatus installed in three portions of the agricultural hillslope, including the riparian zone. Each portion includes three surface runoff parcels, 3 replicates. Diagram adapted from doctorate dissertaion of Robson Williams da Costa Silva
Surface runoff parcels
Parcels to collect surface runoff should have an area of at least 1.5 m2, built in 6 mm thick fiber cement sheets, which must be buried in the ground to form a barrier to prevent the collection of water from upstream and lateral areas to the parcel. Each surface runoff parcel has the square shape of 1 m2 square and a triangular shape of 0.5 m2, totaling an area of 1.5 m2. At the triangular end, a PVC tube is connected, which is also connected to a plastic gallon with a capacity of 20 L. Nylon screens must be placed above the gallon lid to prevent coarse materials from entering the reservoir. The calculation of the total surface runoff (in mm) uses the following equation:
SR = (V/A)*100
where: SR is the surface runoff in mm, V is the volume of water in the gallon in m3, and A is the area of the surface runoff plot in m2.
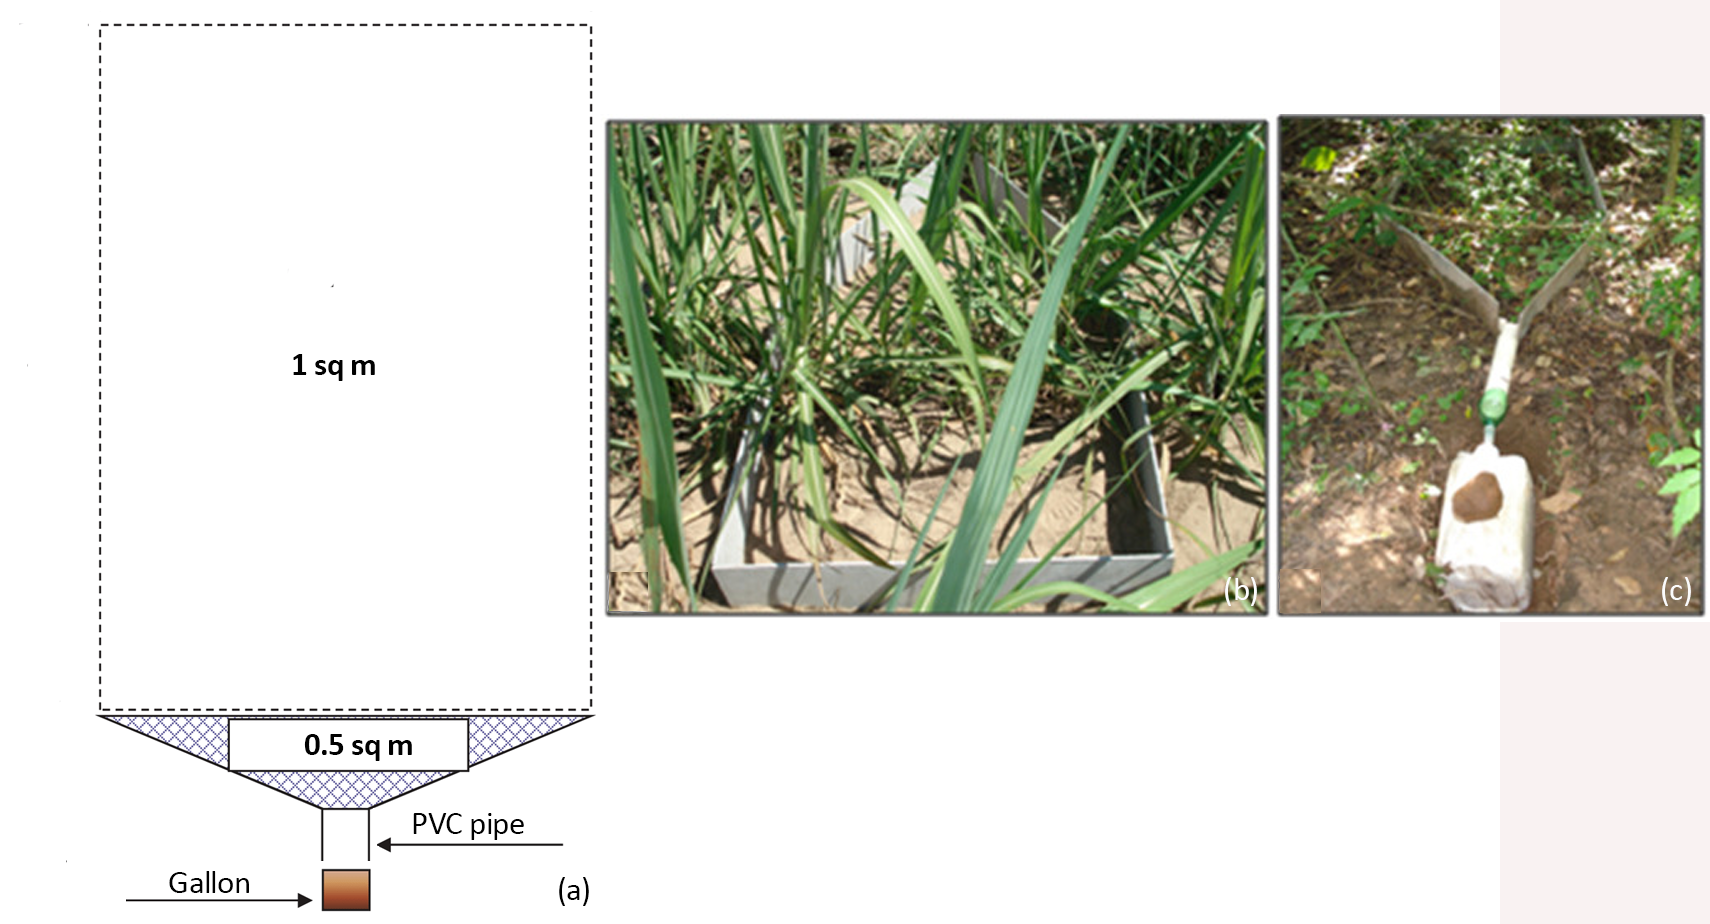
Figure 2 Surface runoff parcel design (a), an example in a sugarcane field (b and c). Photos @ Robson Williams da Costa Silva
Soil solution extractors
Soil solution extractors can be built in 3 cm diameter PVC pipes. The lower end (which will be buried in the ground) should have a porous capsule. The upper end is closed with a rubber stopper. Extractors should be of varying lengths for collecting soil solution at different depths of the soil profile. The figure below exemplifies a manual soil solution extractor installed in the field.
Self-driven extractors are also available and look like the figure below.
The following depths are suggested: 15, 30, 50 cm. The figure is an example of the different depths along the soil profile extractors can be installed.
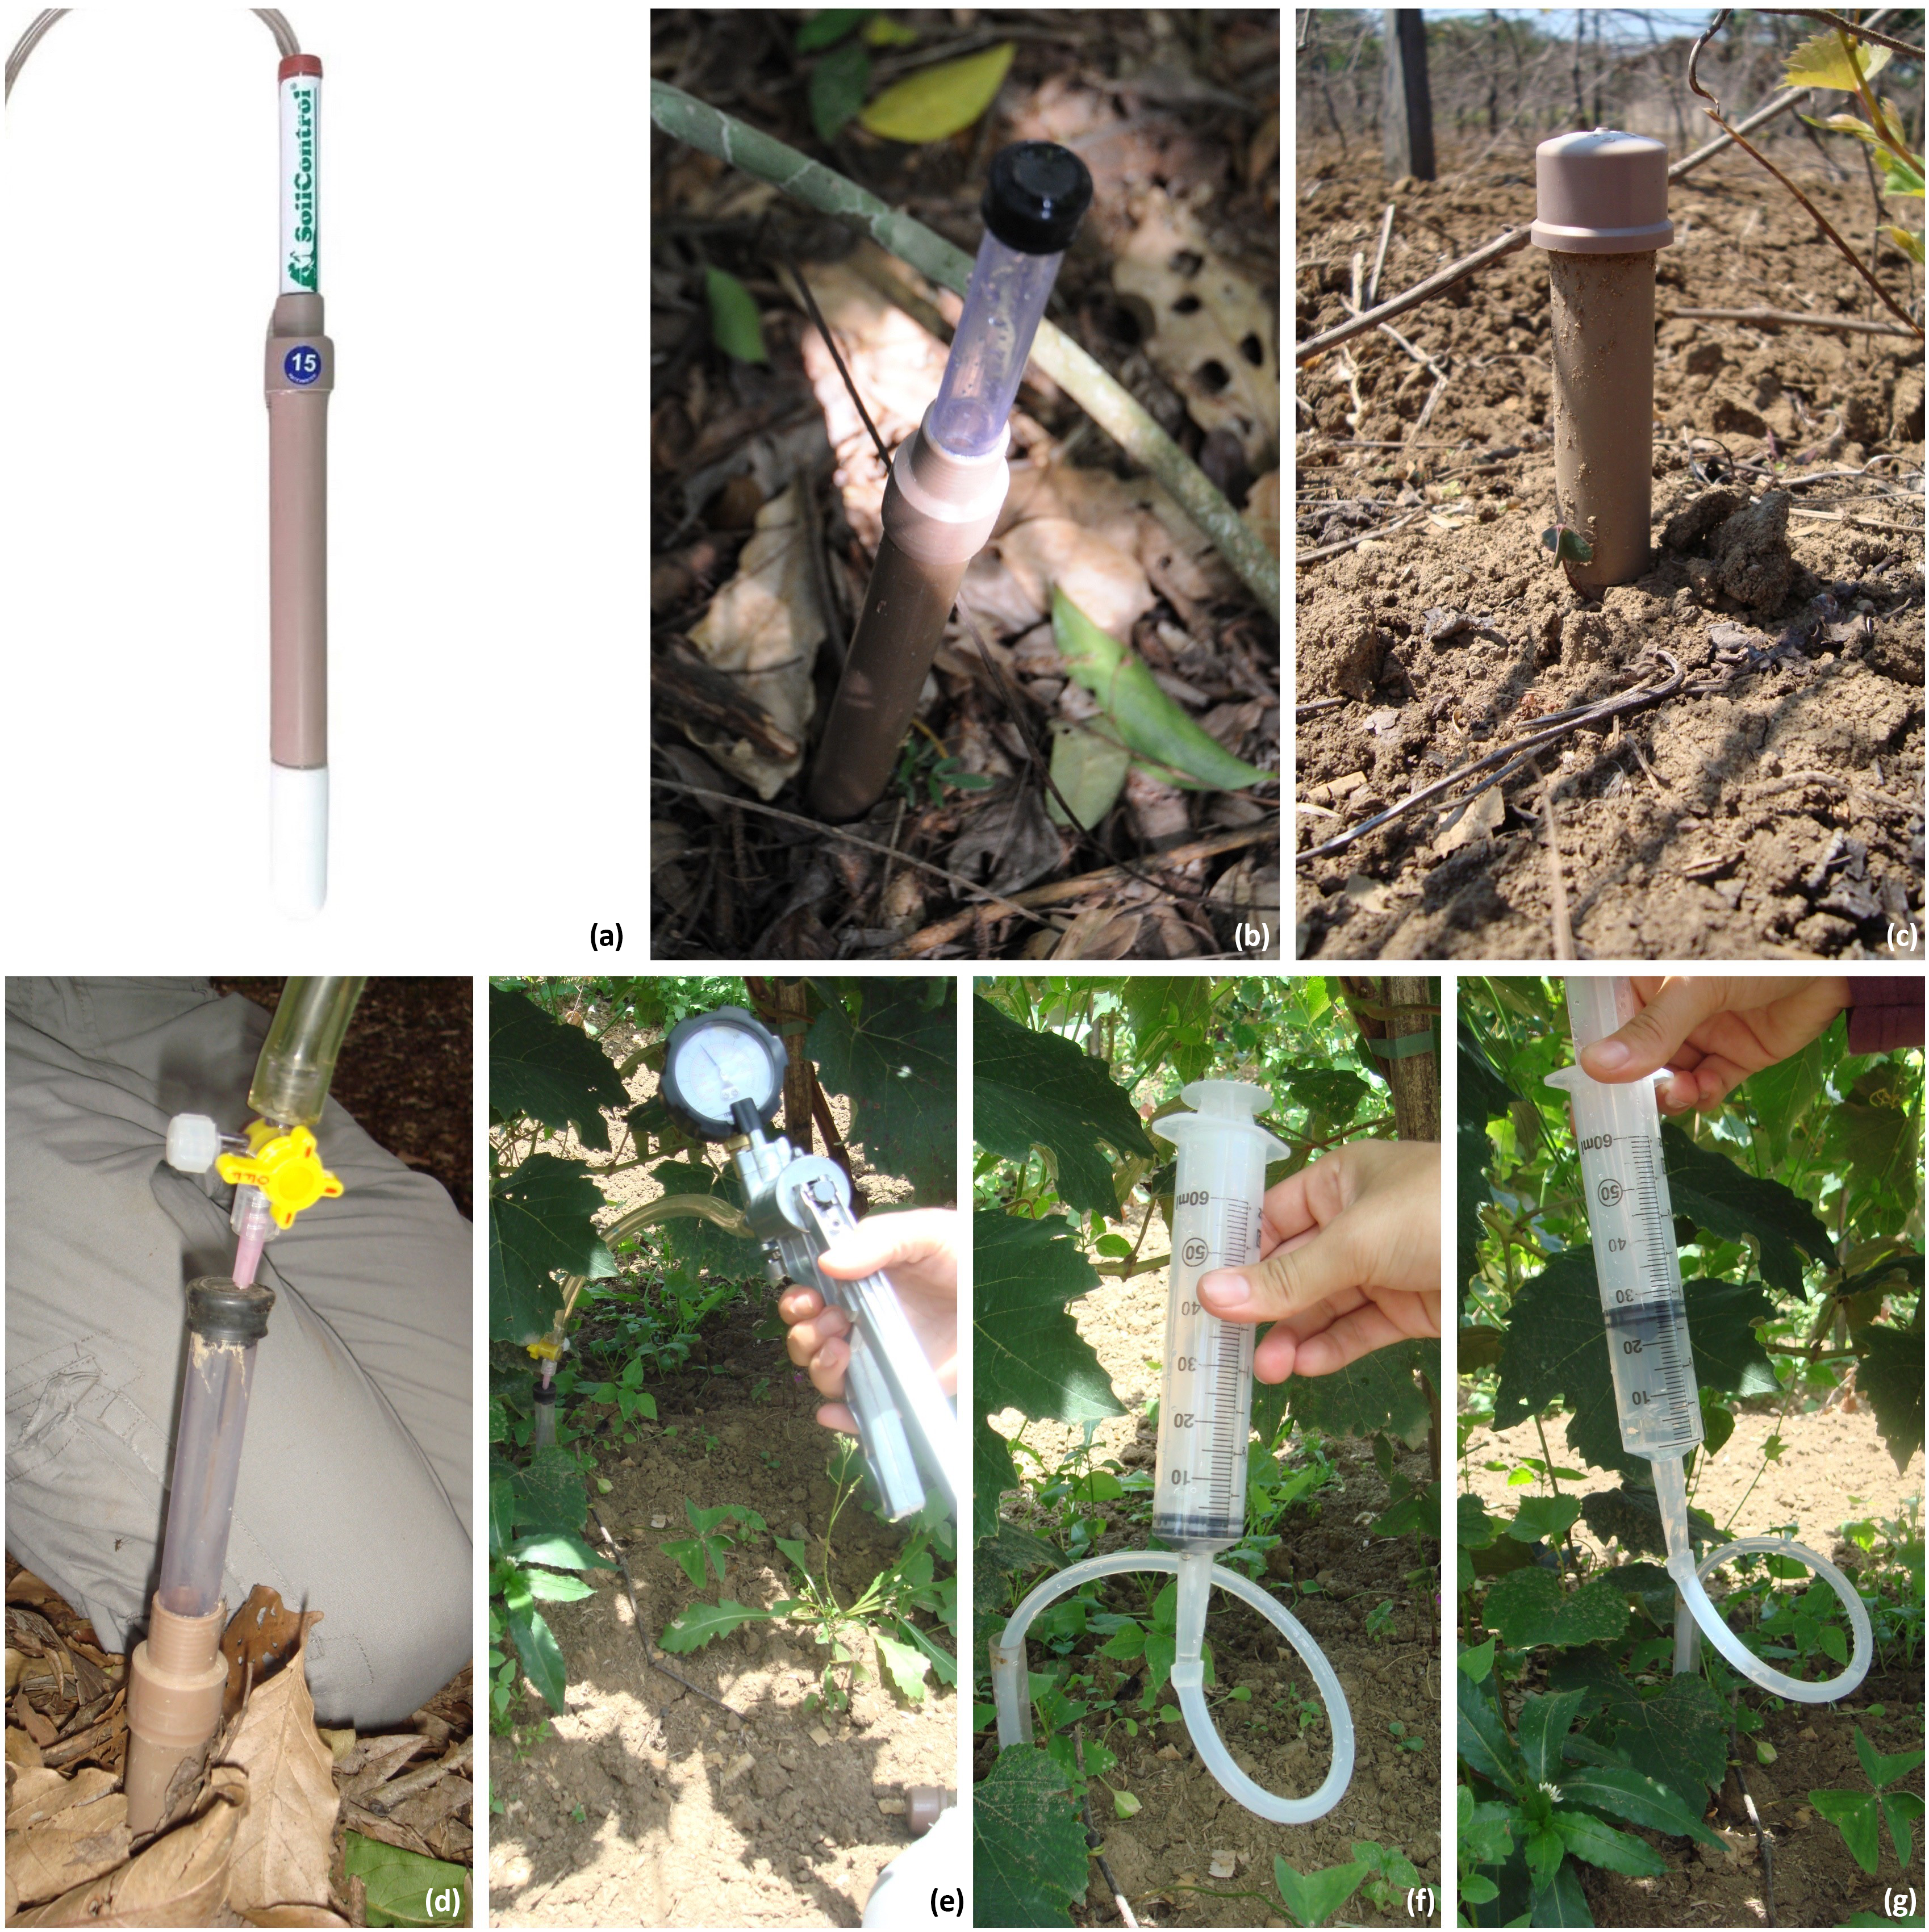
Figure 3 Soil solution extractor (a), installed in the soil with rubber stopper shown (b), installed in the soil with PVC cap over rubber stopper shown (c). Detail of syringe needle inserted into the rubber stopper to apply vacuum (d). Detail to the manual vacuum pump (e). Syringe attached to a silicone tube to suck the water extracted inside the extractor (f). Syringe filled with soil solution water (g). Photos (a) © Mercado Livre (b-g) © Maíra Ometto Bezerra
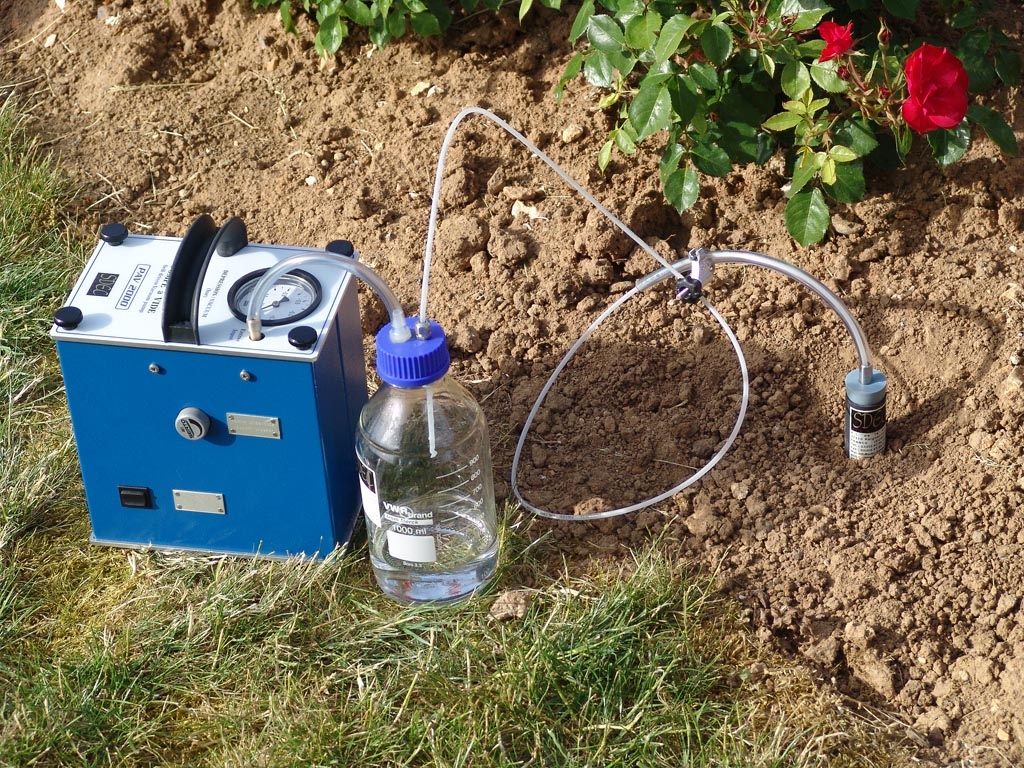
Figure 4 Self-driven soil solution extractor: Source: Solutions Technologiques pour l'Environnement https://www.sdec-france.com/field-use-electric-vacuum-pump-pav-2000.html
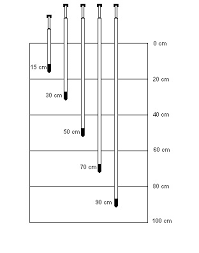
Figure 5 Soil solution extractors in different soil depths. Source: Hidrodinâmica Irrigação http://tensiometro.com.br/Tensimetro.html
Groundwater wells
Groundwater wells can be built in PVC pipes with a diameter of 100 mm. They must have lateral holes to allow water entry. Monitoring of both suspended and deep water tables is suggested when there is a clay impediment layer at shallow depths of the soil profile.
Quantifying N and P in water samples from the soil compartments above involves two basic steps:
- Collecting a water sample.
- Analyzing it in the field or lab for one of the types of N and P described in the pathway of change.
This manual does not address the specifics of collecting the sample in field and laboratory methods. Refer to the links provided in each chapter for that information. Nonetheless, the schematic below provides a brief overview of key tasks. The details for each task can be found in the EPA site.
Sampling design
To obtain a better representation of the concentration of nutrients during the periods of greater movement of material between the soil compartments, it is suggested to collect samples right after rain events (up to 48 hours after the end of the rain event). Water sample collections should focus on the period when most rainfall events occur in a particular landscape. Ideally, samples should be collected for as many rainfall events as possible. The fieldwork logistics will have to be very well organized to allow this sampling design.
Generally, the following should be done within 24 hours prior to the storm event:
- Deployment of clean gallon to collect surface runoff.
- Application of vacuum on the soil extractors. Refer to this manual to learn more about this stage.
Quantification methods
Particulate P
Follow this guidance provided by the University of Maryland Center for Environmental Science to learn about the supplies and procedures for sample collection, preservation and storage to quantify total particulate P (TPP) and particulate inorganic P (PIP) in samples of surface runoff. Preserved samples should be sent for analysis to an accredited nutrient analytical laboratory.
Dissolved N
Follow these guidance provided by the University of Maryland Center for Environmental Science to learn about the supplies and procedures for sample collection, preservation and storage to quantify total dissolved N (TDN) and nitrate in water samples (soil solution and groundwater). Preserved samples should be sent for analysis to an accredited nutrient analytical laboratory.
Dissolved P
Follow these guidance provided by the University of Maryland Center for Environmental Science to learn about the supplies and procedures for sample collection, preservation and storage to quantify total dissolved P (TDP) and orthophosphate in water samples (soil solution and groundwater). Preserved samples should be sent for analysis to an accredited nutrient analytical laboratory.
Main costs
The table below provides information on general costs associated with quantifying nutrient loads. Table refers to 150 water samples in total. As an example, this amount of sample would allow analysis of three storm events, considering the experimental design in the figure above (9 surface runoff parcels, 27 soil solution extractors, and 3 groundwater wells).
Table 1. Main costs to quantify nutrient concentration in soil compartments
| Main group | Costs (Low) | Costs (High) |
|---|---|---|
| Field apparatus | 1,000 | 13,000 |
| Water sampling material | 1,000 | 1,000 |
| Basic supplies | 1,500 | 10,000 |
| Laboratory analysis | 1,500 | 7,500 |
| Total | 5,000 | 31,500 |
Preparation for a field day
The basic for steps to prepare for a field day is detailed in the figure below.
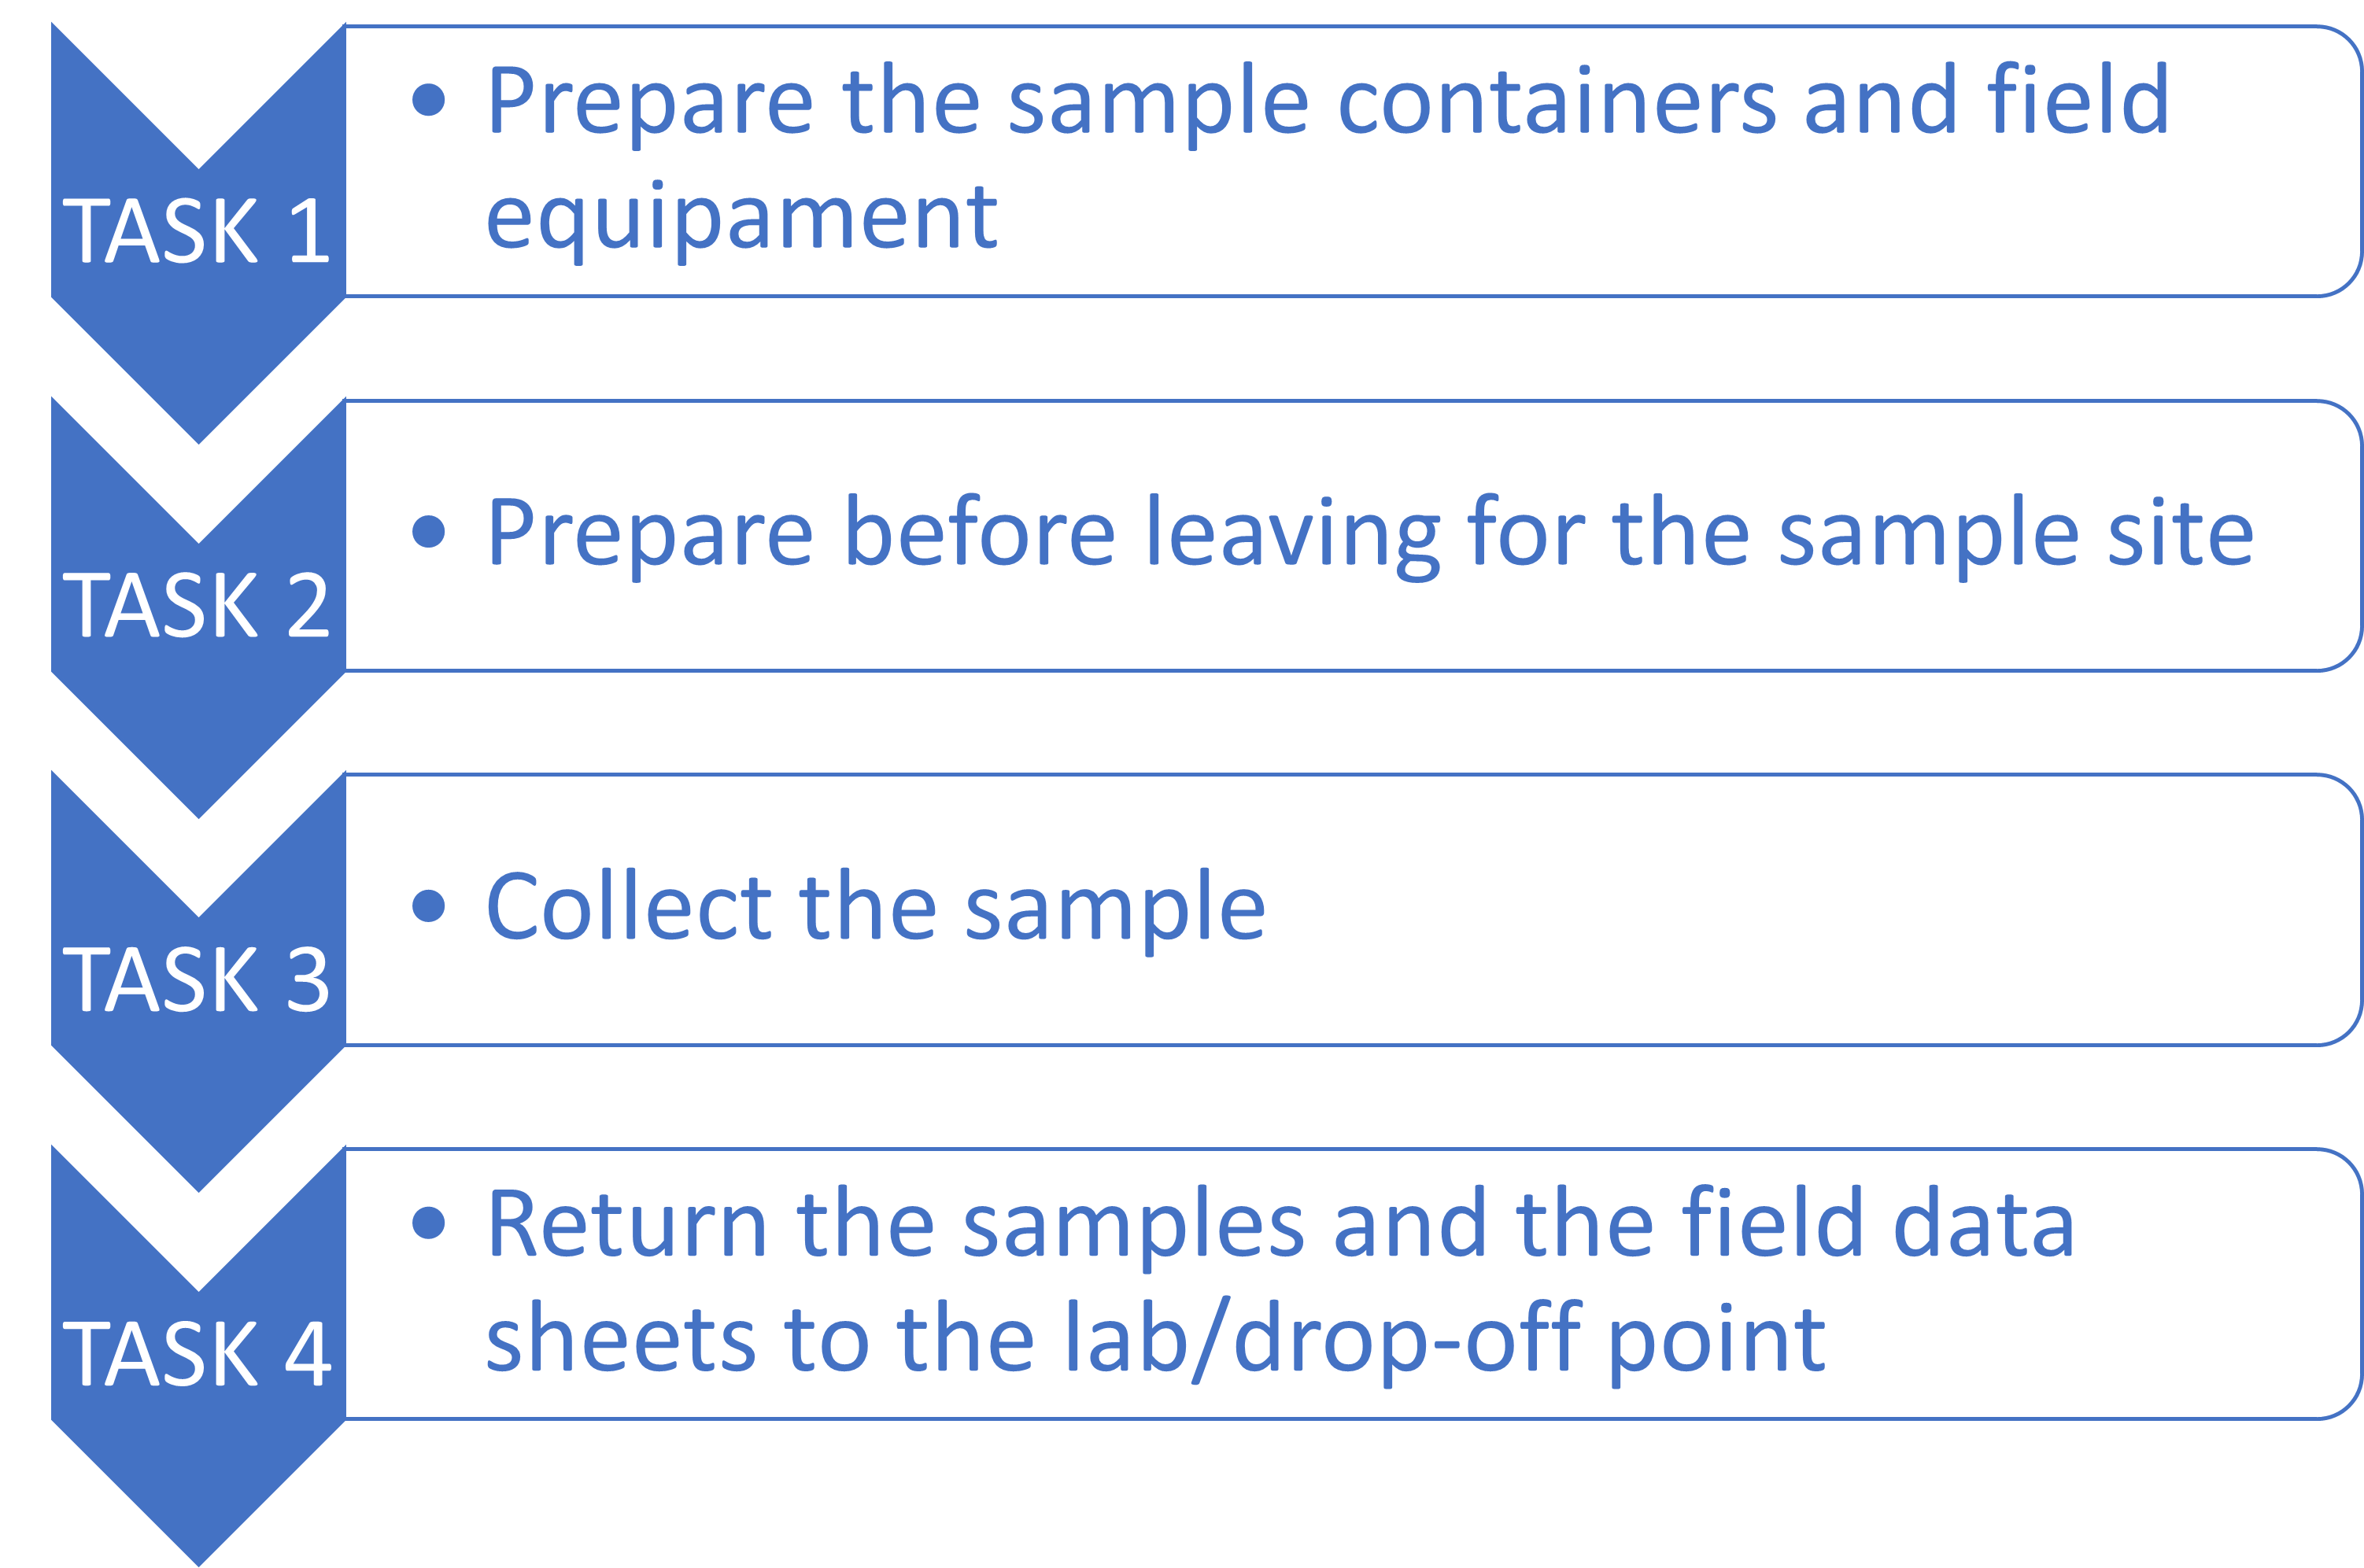
Figure 6 Basic tasks to collect water samples from the soil compartments in the field