Water Quality Instream nutrients
Wednesday, May 18, 2022 6:10 AMMethod description: Instream nutrients
In-stream nutrients, nitrogen (N) and phosphorus (P), are usually quantified by collecting water samples and analyzing them at the laboratory to estimate nutrient concentrations. This provides de most accurate data.
In recent years, technology advanced, and on-site probes have been developed to quantify nutrients in water instantaneously.
When a simplest and cheapest is needed, electrical conductivity can be used as proxy (please, read this paper). Using E.C. to infer about nutrient concentration produces less accurate data.
The use of on-site probes has an advantage that it can provide continuous monitoring, which is usually more comprehensive. Freshwater scientists have agreed that continuous monitoring provides the most accurate view of the system or variable of interest as it can capture the dynamic of a parameter of interest during varying environmental conditions. Therefore, whenever possible, it is preferred to use on-site probes that can be left unattended in the field collecting data at a particular interval.
On-site probes
On-site probes for freshwater monitoring purposes are electrical instruments used to physically examine water parameters at the location they occur. That is, real time measurements are taken at the site level, usually without disturbing the physical environment in any form.
On-site probes can take point measurements, i.e., measurements are taken occasionally because the probe is not left unattended at the field site. In this case, the practitioner visits the field site only occasionally according to a sampling design. Point measurements provide only a snapshot of the system. Probes can also take continuous measurements if they can be left unattended at the field site.
On-site probes exist to monitor total nitrogen, total phosphorus, nitrate, and orthophosphate. Note that none of this is the actual nutrient variable include in the pathway of change.
For on-site probes quality assurance is required to maintain accuracy and keep equipment functioning within specifications, best practice recommends cleaning and calibrating the instruments at regular intervals. It is also recommended to cross-check sensor accuracy against a separate instrument. Projects may even require the use of a Quality Assurance Plan (QAP) that provides a detailed outline of maintenance, calibration, and QA/QC requirements.
Water samples
Sampling for laboratory analysis involves two steps: Collecting samples at the field and bringing them to the laboratory for analysis and quantification of the nutrients of interest.
Some water quality parameters can be analyzed through perception assessments using testing kits, which is cheaper method of quantification.
Testing kits (simpler way to quantify nutrients in water) exist for phosphate and nitrate (which are not the specific variables depicted in the pathway of change). In general, a standard volume of water is added to a plastic tube containing dry reagents that have an increased absorbance with increasing parameter concentrations. The resulting color is assigned to one of several discrete concentration ranges. The test kits from HACH and Kyoritsu PackTests (Kyoritsu Chemical-Check Lab, Corp., Tokyo, Japan) are a great option for various parameters.
Sampling design
The monitoring objectives and the intervention type and configuration will determine the approximate location of the stream or river station. Site-specific characteristics must also be considered to ensure a successful project. Physical constraints of a site, the time required to reach the location, legal and physical access to a site and safety issues must be considered when making site selections.
In general, the following rule of thumb can be used when designing a sampling scheme for the quantification of nutrient concentrations:
- With reach scale interventions: At the location of the aquatic restoration intervention with a before-after-control design.
- With watershed scale intervention: At the outlet of the respective catchment where the aquatic restoration intervention is placed with a before-after-control design.
The easiest and most efficient way to monitor water quality is with a stream gage station installed on a riverbank or standing structure, such as metal rod, a pier or bridge support.
The frequency of sample collection to characterize nutrient concentrations involves collecting samples at both base and stormflows. For the characterization during baseflow, it is recommended to collect water samples twice a month. For the characterization during stormflows, water samples during at least three storm events over the year are recommended. While one water sample usually suffices to characterize concentration of different constituents during baseflow, multiple water samples must be collected during a storm event to capture samples during the entire length of the storm hydrograph.
Quantification methods
Water samples should be analyzed for the variables included in pathway of change and according to the methods below.
Particulate P
Follow this guidance provided by the University of Maryland Center for Environmental Science to learn about the supplies and procedures for sample collection, preservation and storage to quantify total particulate P (TPP) and particulate inorganic P (PIP) in samples of surface runoff. Preserved samples should be sent for analysis to an accredited nutrient analytical laboratory.
Dissolved N
Follow these guidance provided by the University of Maryland Center for Environmental Science to learn about the supplies and procedures for sample collection, preservation and storage to quantify total dissolved N (TDN) and nitrate in water samples (soil solution and groundwater). Preserved samples should be sent for analysis to an accredited nutrient analytical laboratory.
Dissolved P
Follow these guidance provided by the University of Maryland Center for Environmental Science to learn about the supplies and procedures for sample collection, preservation and storage to quantify total dissolved P (TDP) and orthophosphate in water samples (soil solution and groundwater). Preserved samples should be sent for analysis to an accredited nutrient analytical laboratory.
Main costs
The table below provides information on general costs associated with characterizing nutrient concentrations in water. Table includes costs considering costs for one probe and quantification of N and P in 150 water samples in total. As an example, this number of samples would allow yearly analysis of 24 baseflow samples and 5 storm events with 25 sample being collected during each event.
Table 1. Main costs to estimate nutrient concentrations in water samples
| Main group | Costs (low) | Costs (high) |
|---|---|---|
| Field equipment | 25 | 5,000 |
| Water sampling material | 1,000 | 1,000 |
| Basic supplies | 1,500 | 10,000 |
|Laboratory analysis*|1,500|7,500| |Total|4,025|23,500|
*Costs to analyze one water sample depend on the constituents that will be analyzed. For example, nutrient analytical facilities commonly process sample suites consisting of a fix pre-determined substances (e.g., a sample suite can be ammonium, orthophosphate, silicate, and nitrate+nitrite) and the cost to analyze one sample can be as high as US$26.
Alternative route for analytical procedures is the use of test kits to measure turbidity, nitrate, and orthophosphate. Costs per 100 samples for each parameter are US$ 150, 250, and 120, respectively.
Costs can vary significantly depending on the goals of the monitoring scheme.
Preparation for a field day
The basic for steps to prepare for a field day is detailed in the figure below.
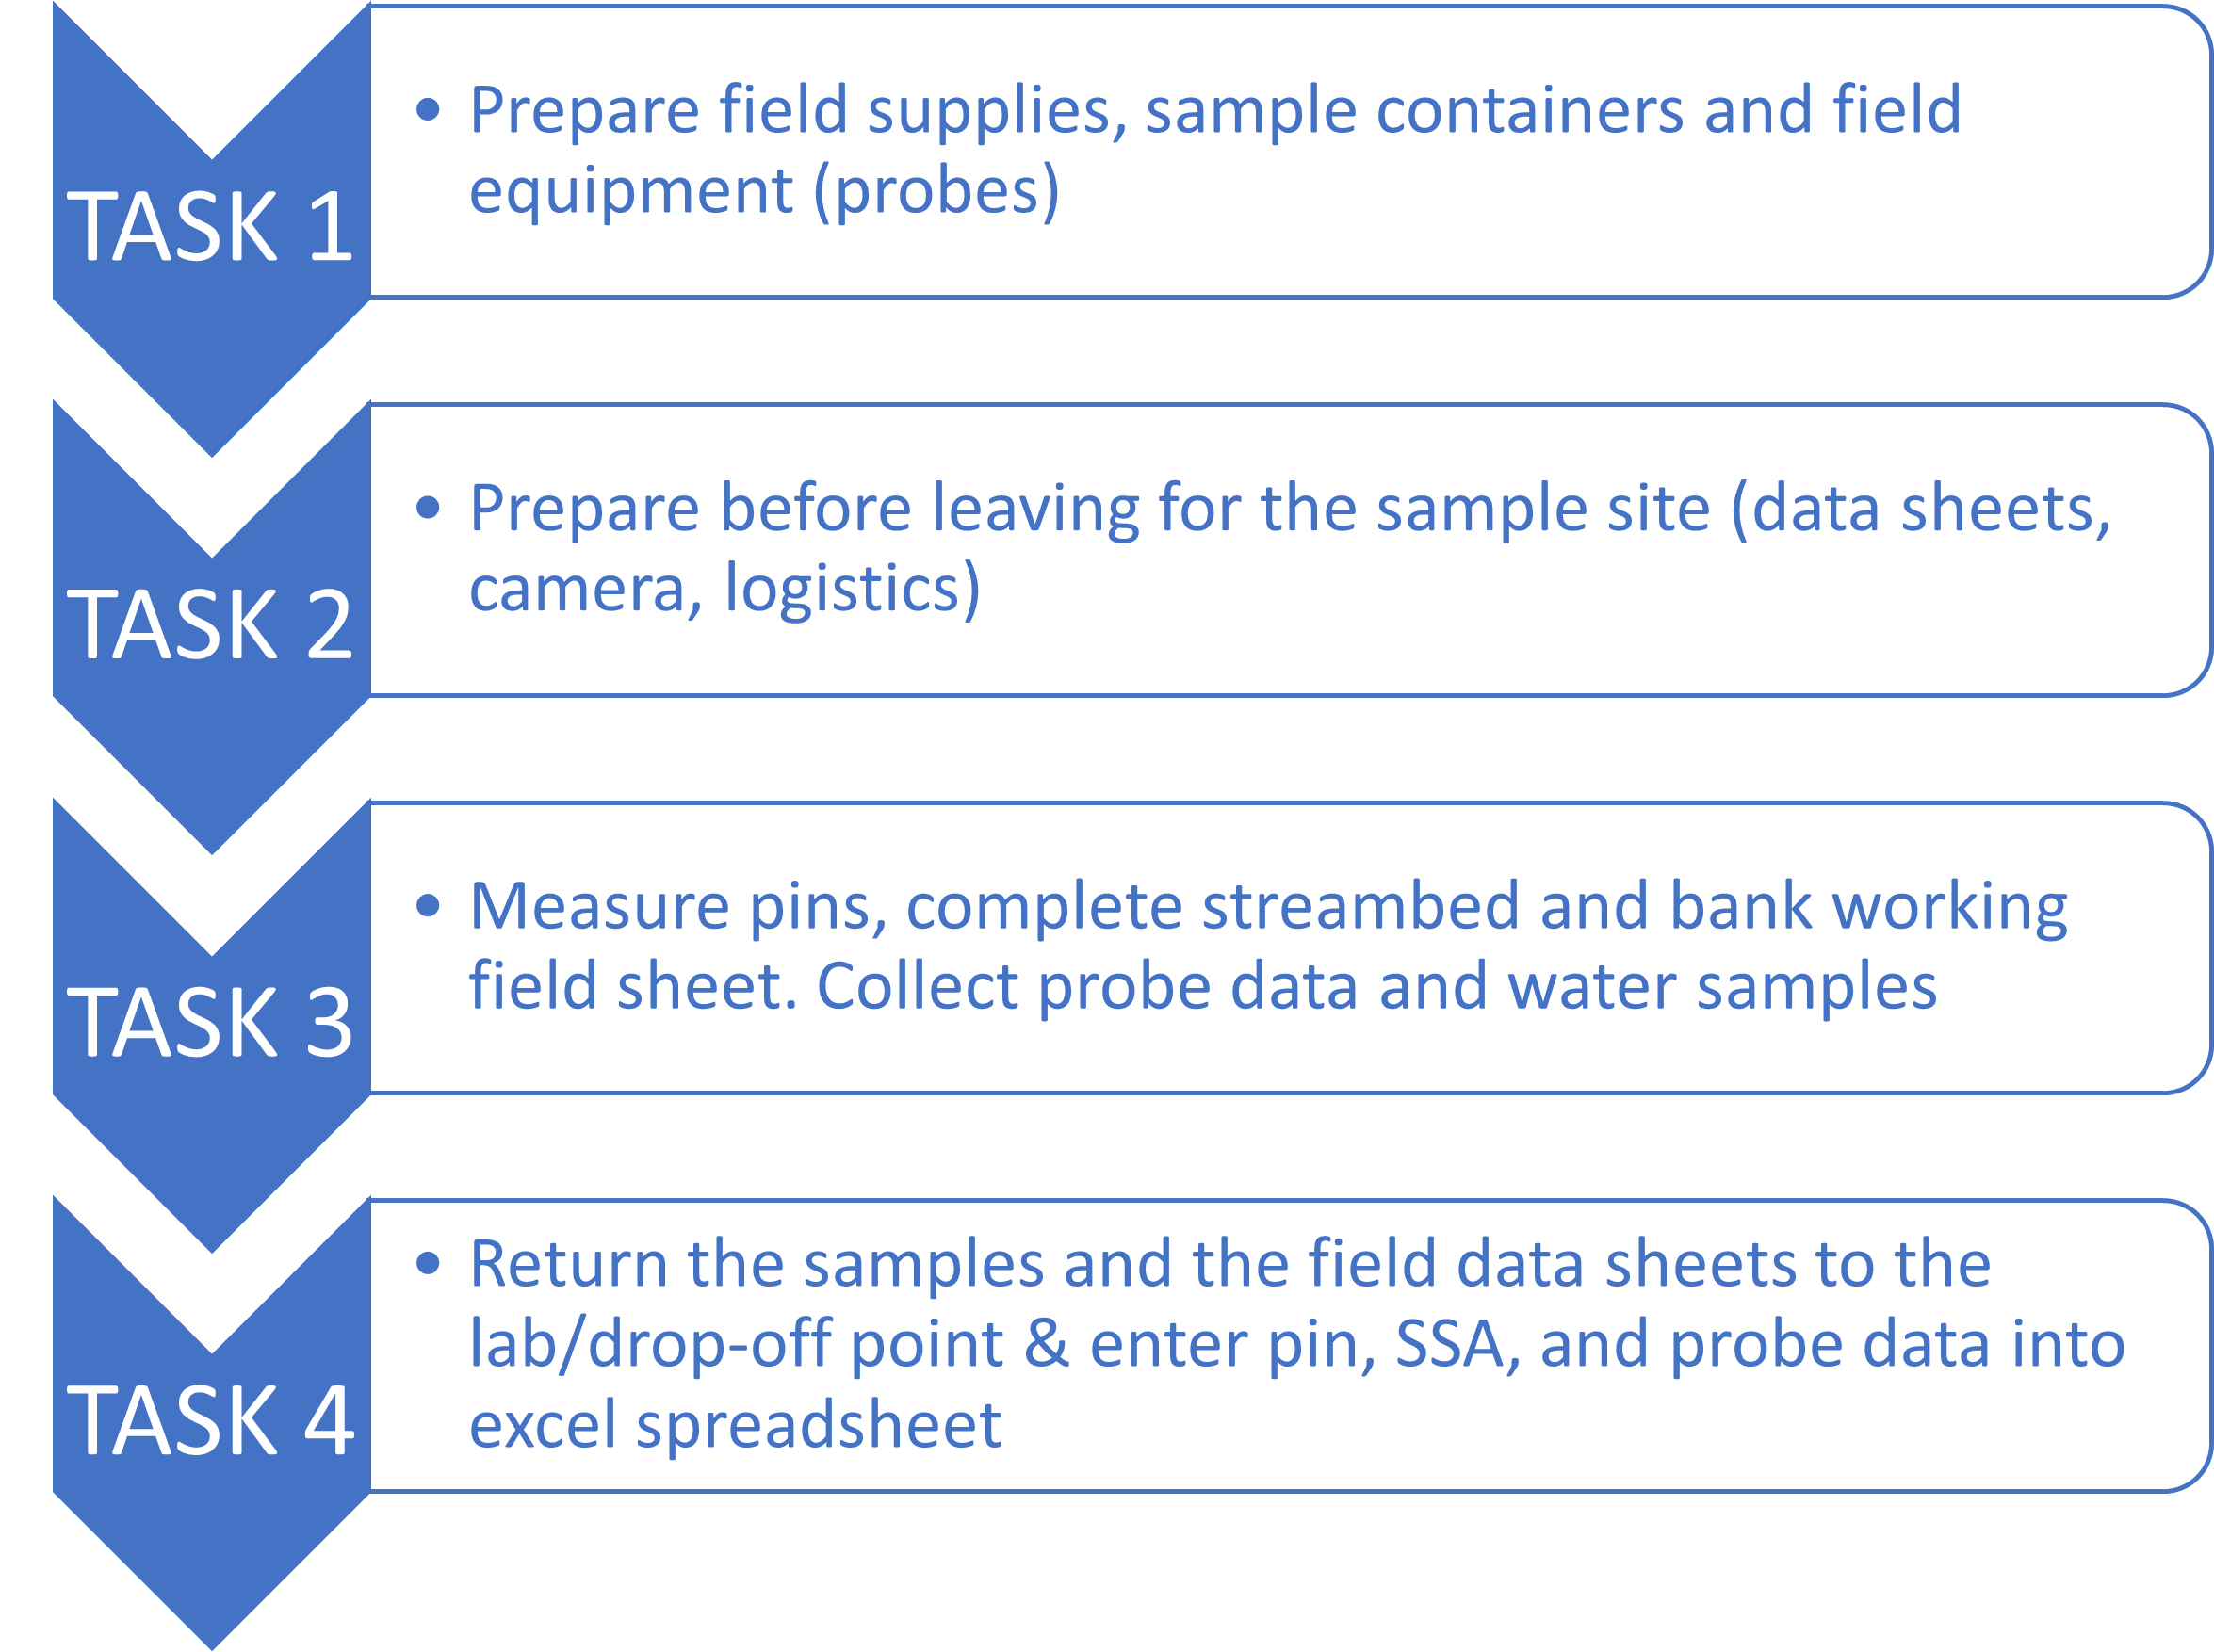
Figure 2 Basic tasks for a successful field day to characterize nutrient concentrations in water samples