Soil Erosion Watch water flows
Wednesday, May 18, 2022 4:44 AMMethod description: Watch water flows
The locations where water converges and flows in small channels on land are identified. These areas are most vulnerable to erosion. Once these areas are known, they can be monitored regularly using binary response surface flow sensors.
Response surface flow sensor is a binary polypropylene float switch that is positioned on the bed of the small channels. The float switch closes a circuit when surface water is present (wet) and opens the circuit when surface water was absent (dry) as depicted in the figure below. A state data logger connected to the float switch then records the timing and duration of water presence as state changes in the circuit (i.e., surface water presence or absence as binary events). Prior field observations are needed to determine an average flow depth required to trigger a state change from opened to closed, and from closed to opened.
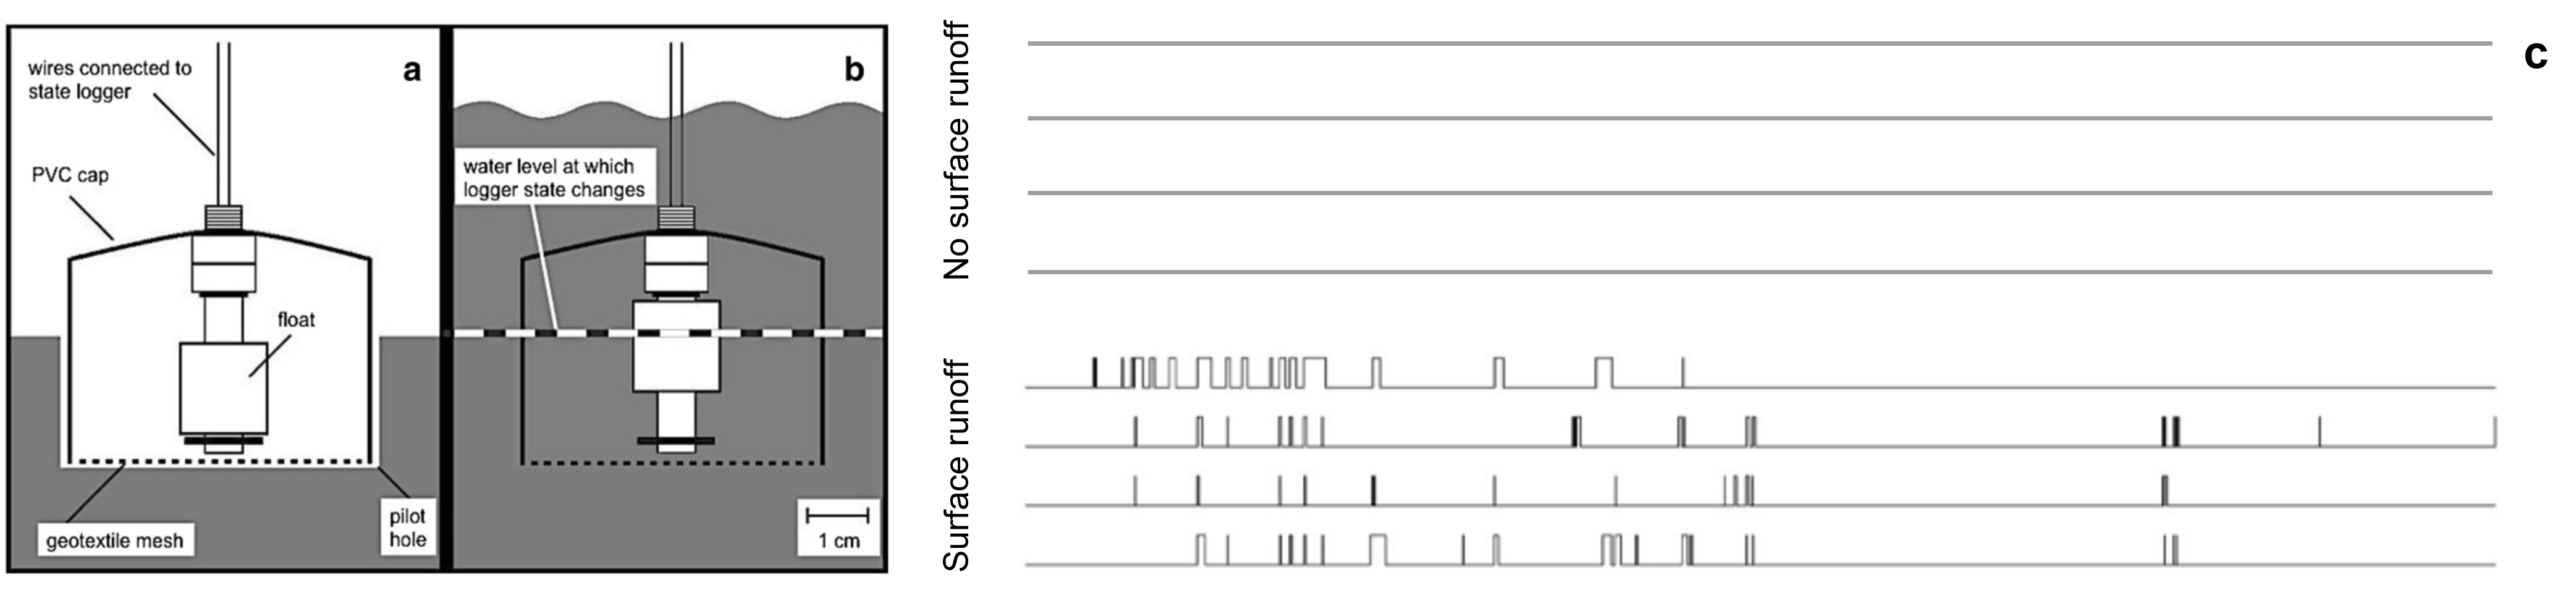
Figure 1 Schematic of buoyant polypropylene float switch. The float switch state is open when water is absent (a) and closed when water is present (b). An associated state data logger records the timing of state changes. Example of data from float switch when no surface runoff is present and when surface runoff is present (c). All adapted from McDonough et al. 2015
Sampling design
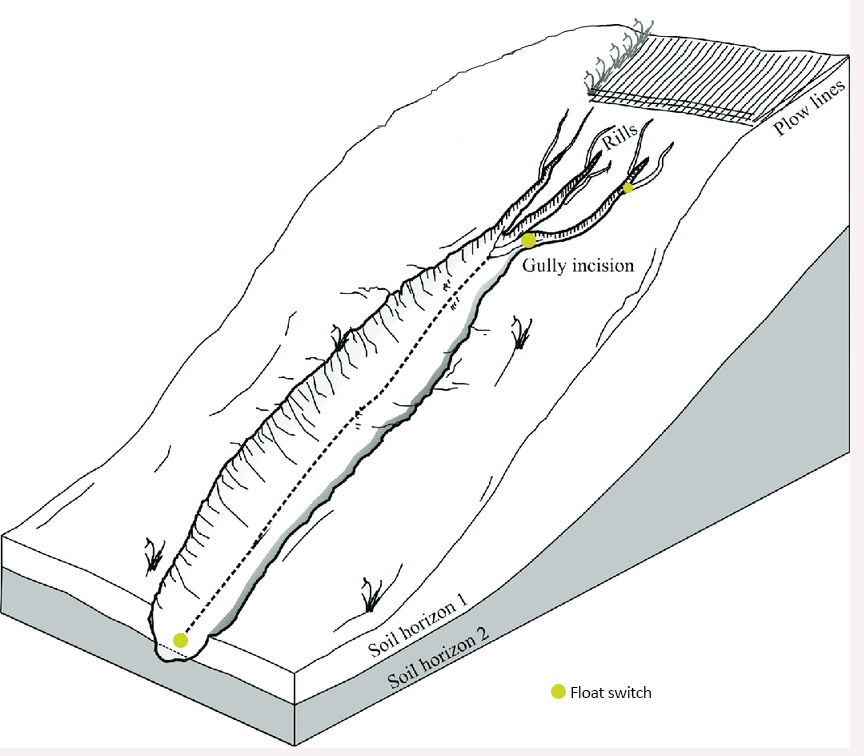
Float switches must be installed where water flows along the hillslope, for example, according to the figure below. The goal is to monitor the most relevant water flow paths; therefore, the total number of monitoring locations will vary depending on the particularities of each watershed. Specific erosional features that should be monitored are: rills erosion and ephemeral gullies. Sampling frequency should include, at least, one hydrological year.
Quantification method to assess water flows
State data logger records are used to calculate cumulative duration, number of connectivity transitions, mean duration, and maximum individual event duration of surface flow events in erosional feature. Maximum individual event duration can be defined as the longest duration (in days) of continuous surface connectivity. The hypothesis is that, with the implementation of NbS, surface runoff decreases, so does the runoff along erosional features. Hence, the potential for continuous soil erosion decreases or ceases.
Main costs
Main costs are provided in the table below, with an example considering the monitoring of three erosional features.
Table 1. Main costs to estimate water flows
| Supply | Cost per unit (USD) | Cost to survey 3 erosional features (USD) |
|---|---|---|
| Binary polypropylene float switch | 10.00 | 30.00 |
| State data logger | 100.00 | 300.00 |
| Float switch housing | 50.00 | 150.00 |
| TOTAL | 160.00 | 480.00 |
Preparation for a field day
The basic for steps to prepare for a field day to characterize water flows along a hillslope.
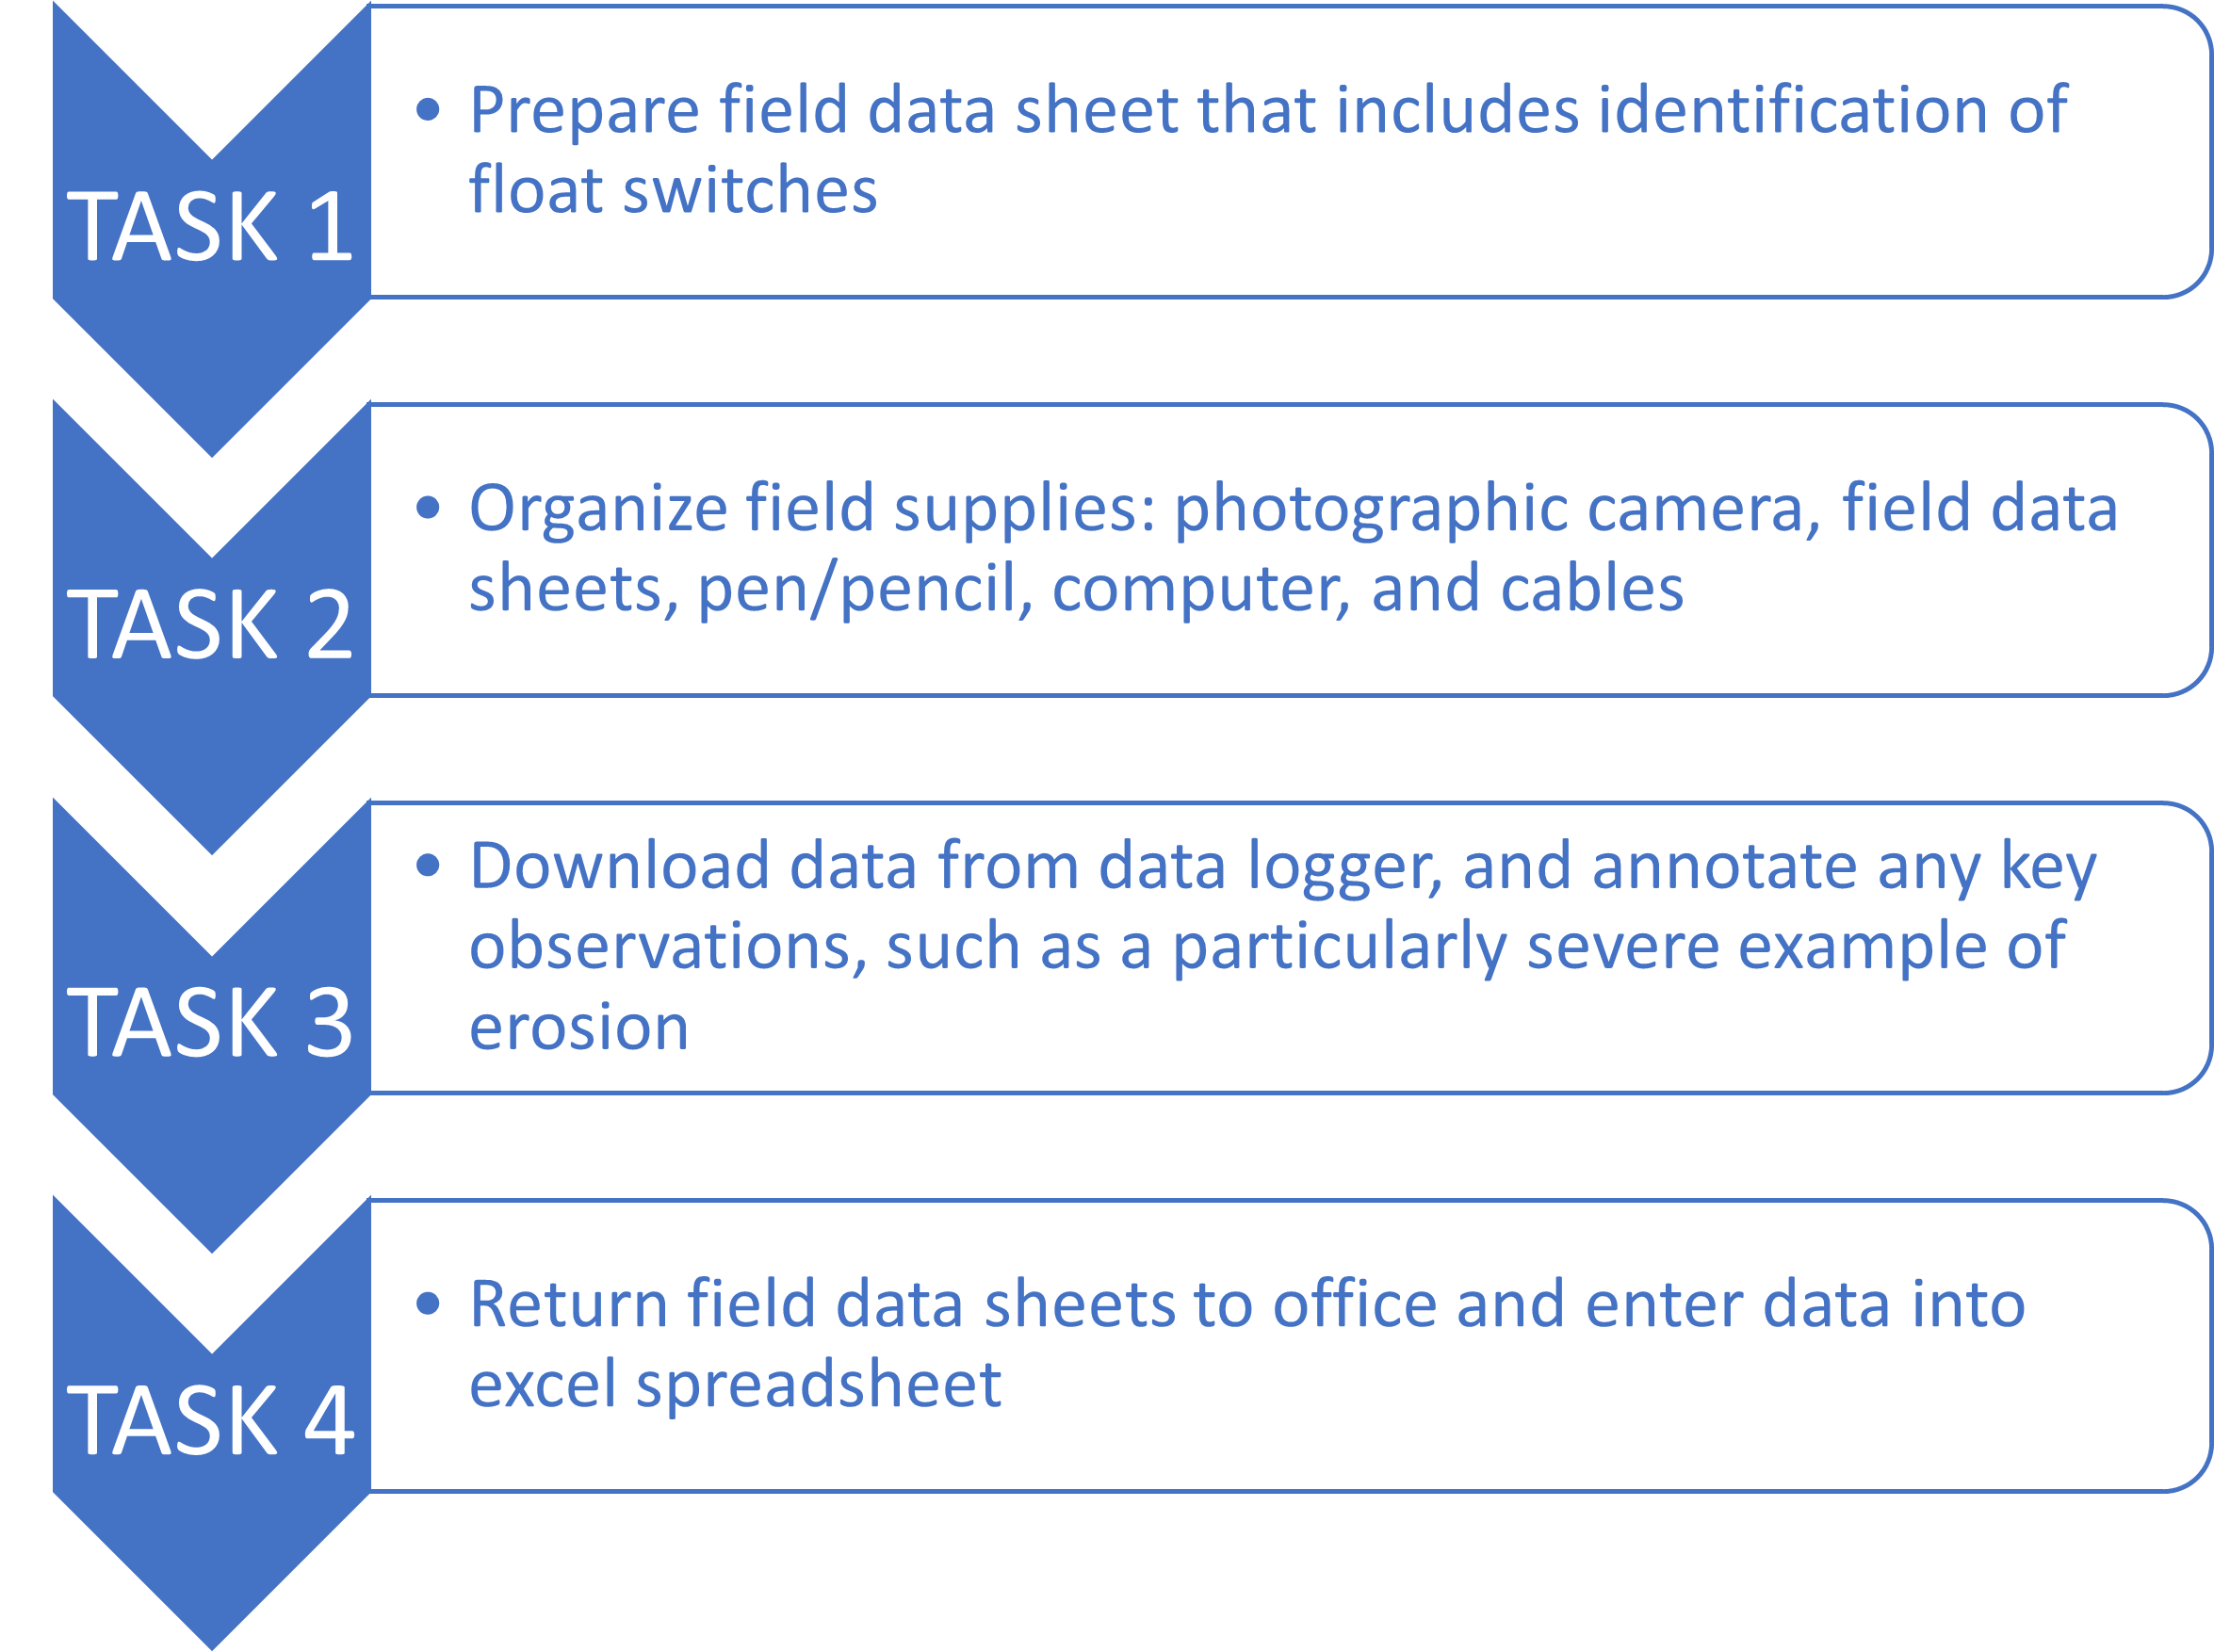
Figure 2 Basic tasks for a successful field day to characterize water flows