Water Quality Instream sediments
Wednesday, May 18, 2022 6:07 AMMethod description: instream sediments
The method to quantify in-stream sediment involves collecting water samples and analyzing them at the laboratory to determine sediment concentrations. Alternatively, turbidity (measure of relative clarity of a liquid) is commonly used as a proxy of sediment concentrations. Quantification of sediment concentrations using turbidity requires the development of rating curves to relate turbidity values to specific sediment concentrations. Development of sediment rating curves involves collect a few water samples during base and stormflows (this video walks one through the method to develop sediment rating curves).
The use of on-site probes has an advantage that it can provide continuous monitoring, which is usually more comprehensive. Freshwater scientists have agreed that continuous monitoring provides the most accurate view of the system or variable of interest as it can capture the dynamic of a parameter of interest during varying environmental conditions. Therefore, whenever possible, it is preferred to use on-site probes that can be left unattended in the field collecting data at a particular interval.
When a simplest and cheapest is needed, electrical conductivity can be used as proxy (please, read this paper). Using E.C. to infer about sediment concentration produces less accurate data.
The techniques described above provide information on the suspended portion, which is only half of the story in terms of sediment transport through stream and rivers. The other portion is bed sediment. Because quantifying bed sediment is complex, this topic is not covered in this manual
On-site probes
On-site probes for freshwater monitoring purposes are electrical instruments used to physically examine water parameters at the location they occur. That is, real time measurements are taken at the site level, usually without disturbing the physical environment in any form.
On-site turbidity probes can take point measurements, i.e., measurements are taken occasionally because the probe is not left unattended at the field site. In this case, the practitioner visits the field site only occasionally according to a sampling design. Point measurements provide only a snapshot of the system. Probes can also take continuous measurements if they can be left unattended at the field site.
For on-site probes quality assurance is required to maintain accuracy and keep equipment functioning within specifications, best practice recommends cleaning and calibrating the instruments at regular intervals. It is also recommended to cross-check sensor accuracy against a separate instrument. Projects may even require the use of a Quality Assurance Plan (QAP) that provides a detailed outline of maintenance, calibration, and QA/QC requirements.
Water samples
Sampling for laboratory analysis to estimate suspended sediment concentrations involves two steps: Collecting samples at the field and bringing them to the laboratory for analysis and quantification of the nutrients of interest.
Turbidity can be analyzed through perception assessments using testing kits, which is cheaper method of quantification. In general, a standard volume of water is added to a plastic tube containing dry reagents that have an increased absorbance with increasing parameter concentrations. The resulting color is assigned to one of several discrete concentration ranges. The test kits from HACH and Kyoritsu PackTests (Kyoritsu Chemical-Check Lab, Corp., Tokyo, Japan) are a great option for various parameters.
Sampling design
The monitoring objectives and the intervention type and configuration will determine the approximate location of the stream or river station. Site-specific characteristics must also be considered to ensure a successful project. Physical constraints of a site, the time required to reach the location, legal and physical access to a site and safety issues must be considered when making site selections.
In general, the following rule of thumb can be used when designing a sampling scheme for the quantification of nutrient concentrations:
- With reach scale interventions: At the location of the aquatic restoration intervention with a before-after-control design.
- With watershed scale intervention: At the outlet of the respective catchment where the aquatic restoration intervention is placed with a before-after-control design.
The easiest and most efficient way to monitor suspended sediment is with a stream gage station installed on a riverbank or standing structure, such as metal rod, a pier or bridge support. A on-site probe can be installed in this station as well as water samples collected.
The frequency of sample collection to characterize suspended sediment concentrations involves collecting samples at both base and stormflows. For the characterization during baseflow, it is recommended to collect water samples twice a month. Sample collection in this case can be done by grabbing water directly from the stream or by using a sample collector apparatus, both with example pictures below. For the characterization during stormflows, water samples during at least three storm events over the year are recommended but alternative, cheaper ways can be thought to collect water samples during stormflows as exemplified in Figure 2. For this a automatic sampler is recommended as exemplified in the figure below. While one water sample usually suffices to characterize concentration of different constituents during baseflow, multiple water samples must be collected during a storm event to capture samples during the entire length of the storm hydrograph.
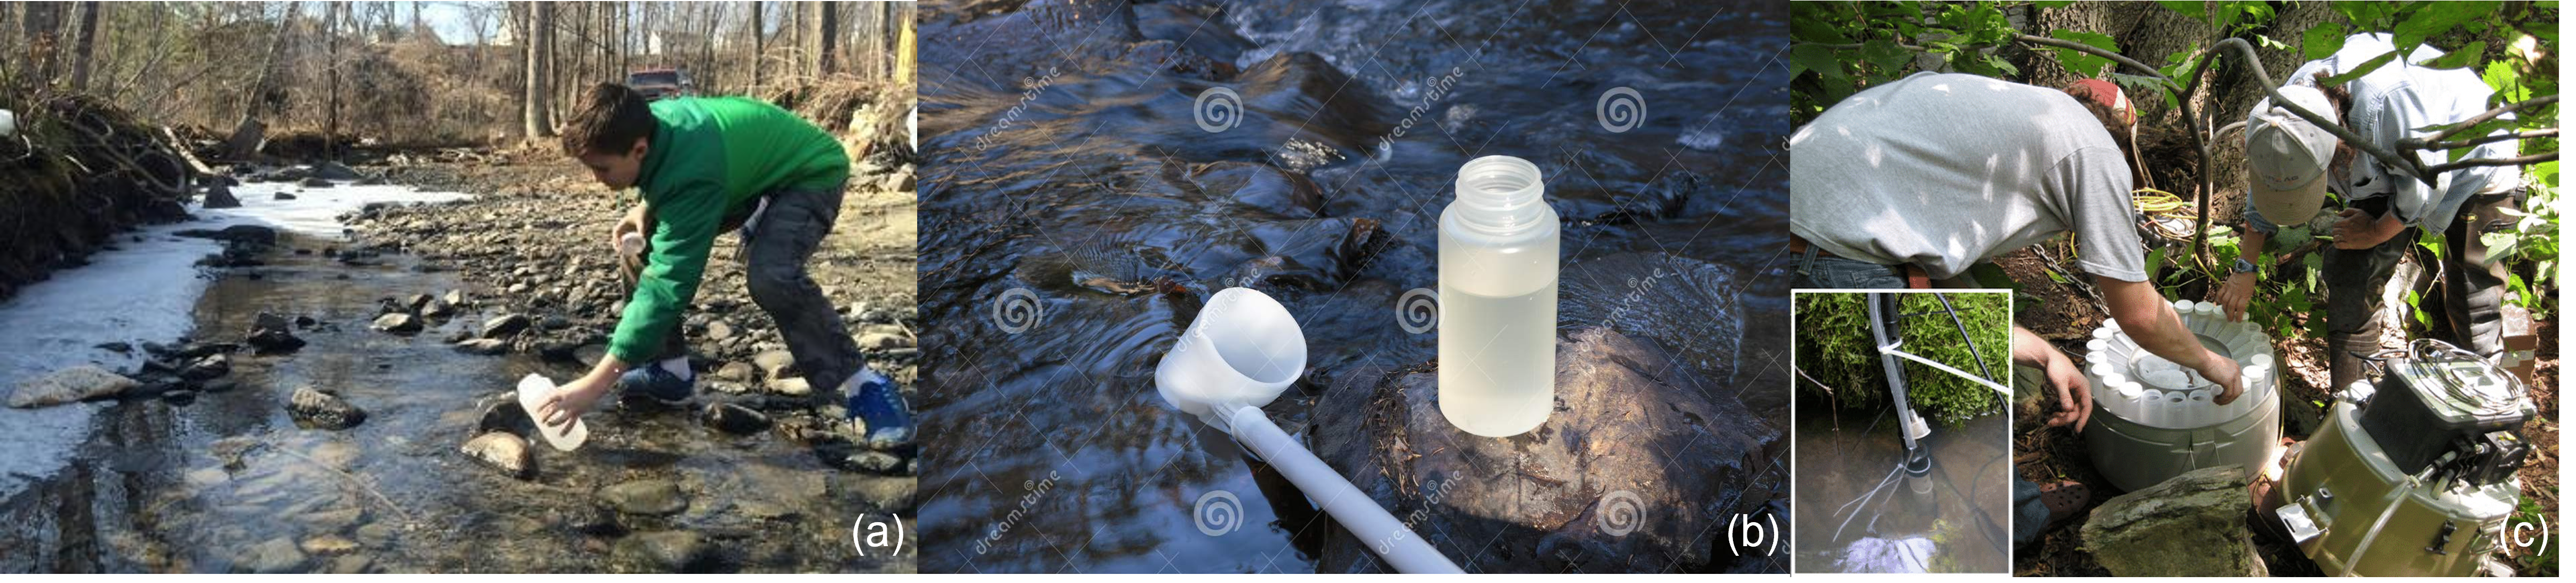
Figure 1 Examples of stream water sampler. Grab sample (a), bucket attached to a rod (b) ISCO automatic sampler. Sources, respectively: Aqualytical; Dreamstime; and Toran et al. 2019*
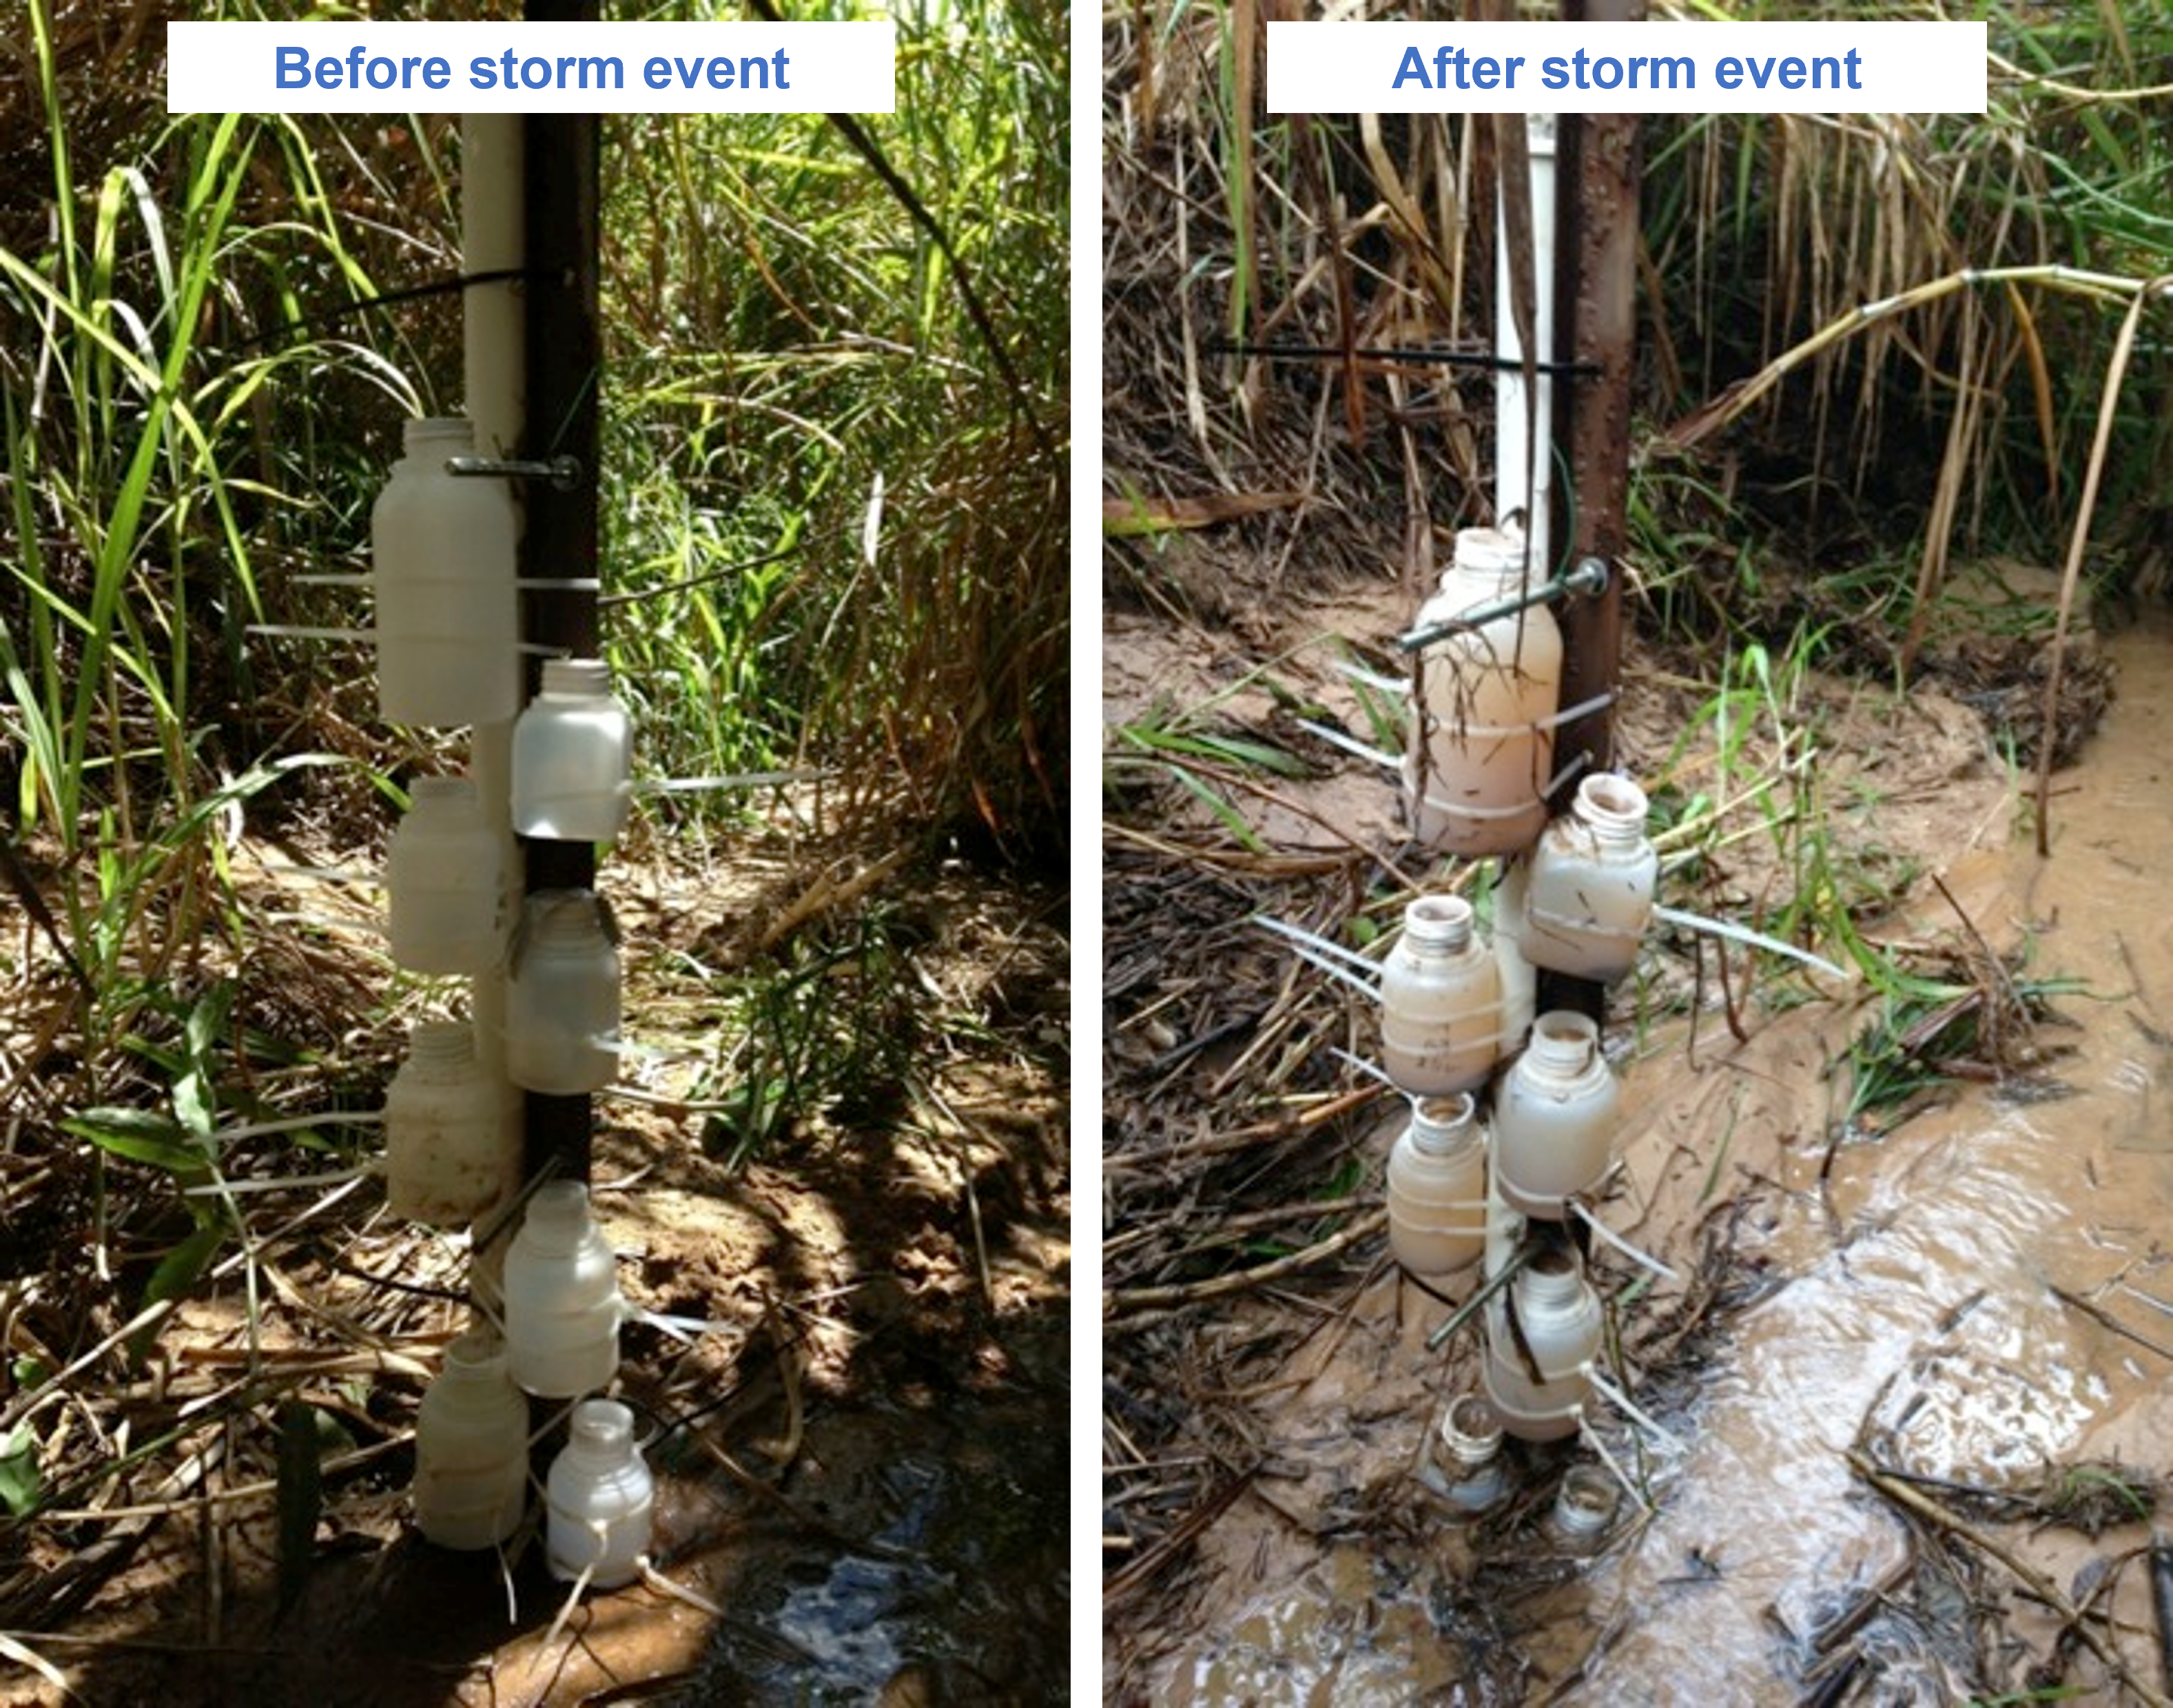
Figure 2 Alternative sediment sampler—single stage sampler—for stormflow samples in a stream draining sugarcane fields in Brazil. Sampler is inspired in the U-59 samplers © Maíra Ometto Bezerra
Quantification methods
There are several ways to quantify suspended sediment:
- Turbidity: The amount of light transmission due to absorption and scattering as affected by suspended sediments [nephelometric turbidity units (NTU)] using on-site probe.
- Total suspended solids (TSS, also termed total filterable solids): Suspended organic and inorganic solids that are not in solution, and which can be removed by filtration (mg/L) using water sampling. Read here to learn the specific method for this.
- Suspended sediment concentration (SSC): Dry weight of sediment from a known volume of water-sediment mixture (clay, silt, sand, and organic matter) (mg/L). Uses a similar method as described for TSS but SSC data are produced by measuring the dry weight of all the sediment from a known volume of a water-sediment mixture.
- Light penetration: Amount of light that can reach various depths of water due to attenuation [Secchi depth (m) or extinction coefficient].
- Water clarity: Qualitatively reported observations of transparency of water.
Main costs
The table below provides information on general costs associated with characterizing suspended concentrations in water. Table includes costs considering the monitoring of one stream in which 2 baseflow samples are collected plus 10 water samples in 3 storm events. This is an example of the minimum requirement.
Table 1. Main costs to estimate suspended sediment concentrations in water samples
| Supplies | US$ unit cost | US$ cost 54 samples (1 stream with 24 baseflow samples + 3 storm events with 10 samples each) |
|---|---|---|
| Water sampling material | ||
| * | 4,600.00 | 4,600.00 |
| 1-L Water sample bottles | |
|
| Cooler | |
|
| Eco-ice | |
|
| Basic laboratory supplies | ||
| Ultra-pure-water filtration system | |
|
| Chloridic acid (2.5 L) | |
|
| Drying paper (case 4000) | |
|
| Drying rack tray | |
|
| Drying rack hanger | |
|
| Water filtration system (diam. 25 mm) | |
|
| Fiber-glass filters (GF/F nominal pore size 0.7 um, diam 25mm) | |
|
| Tweezer | |
|
| High precision scale - 3 kg (0.01 g) | |
|
| Drying oven - 60L | |
|
| Aluminum paper (25ft) | |
|
| TOTAL | |
|
* The alternative sampler as indicated in figure 2 can be built for about US$25.00
Alternative route for analytical procedures is the use of test kits to measure turbidity, which won’t require any laboratory supply. Costs per 100 samples is US$ 150.
Costs can vary significantly depending on the goals of the monitoring scheme.
Preparation for a field day
The basic for steps to prepare for a field day is detailed in the figure below.
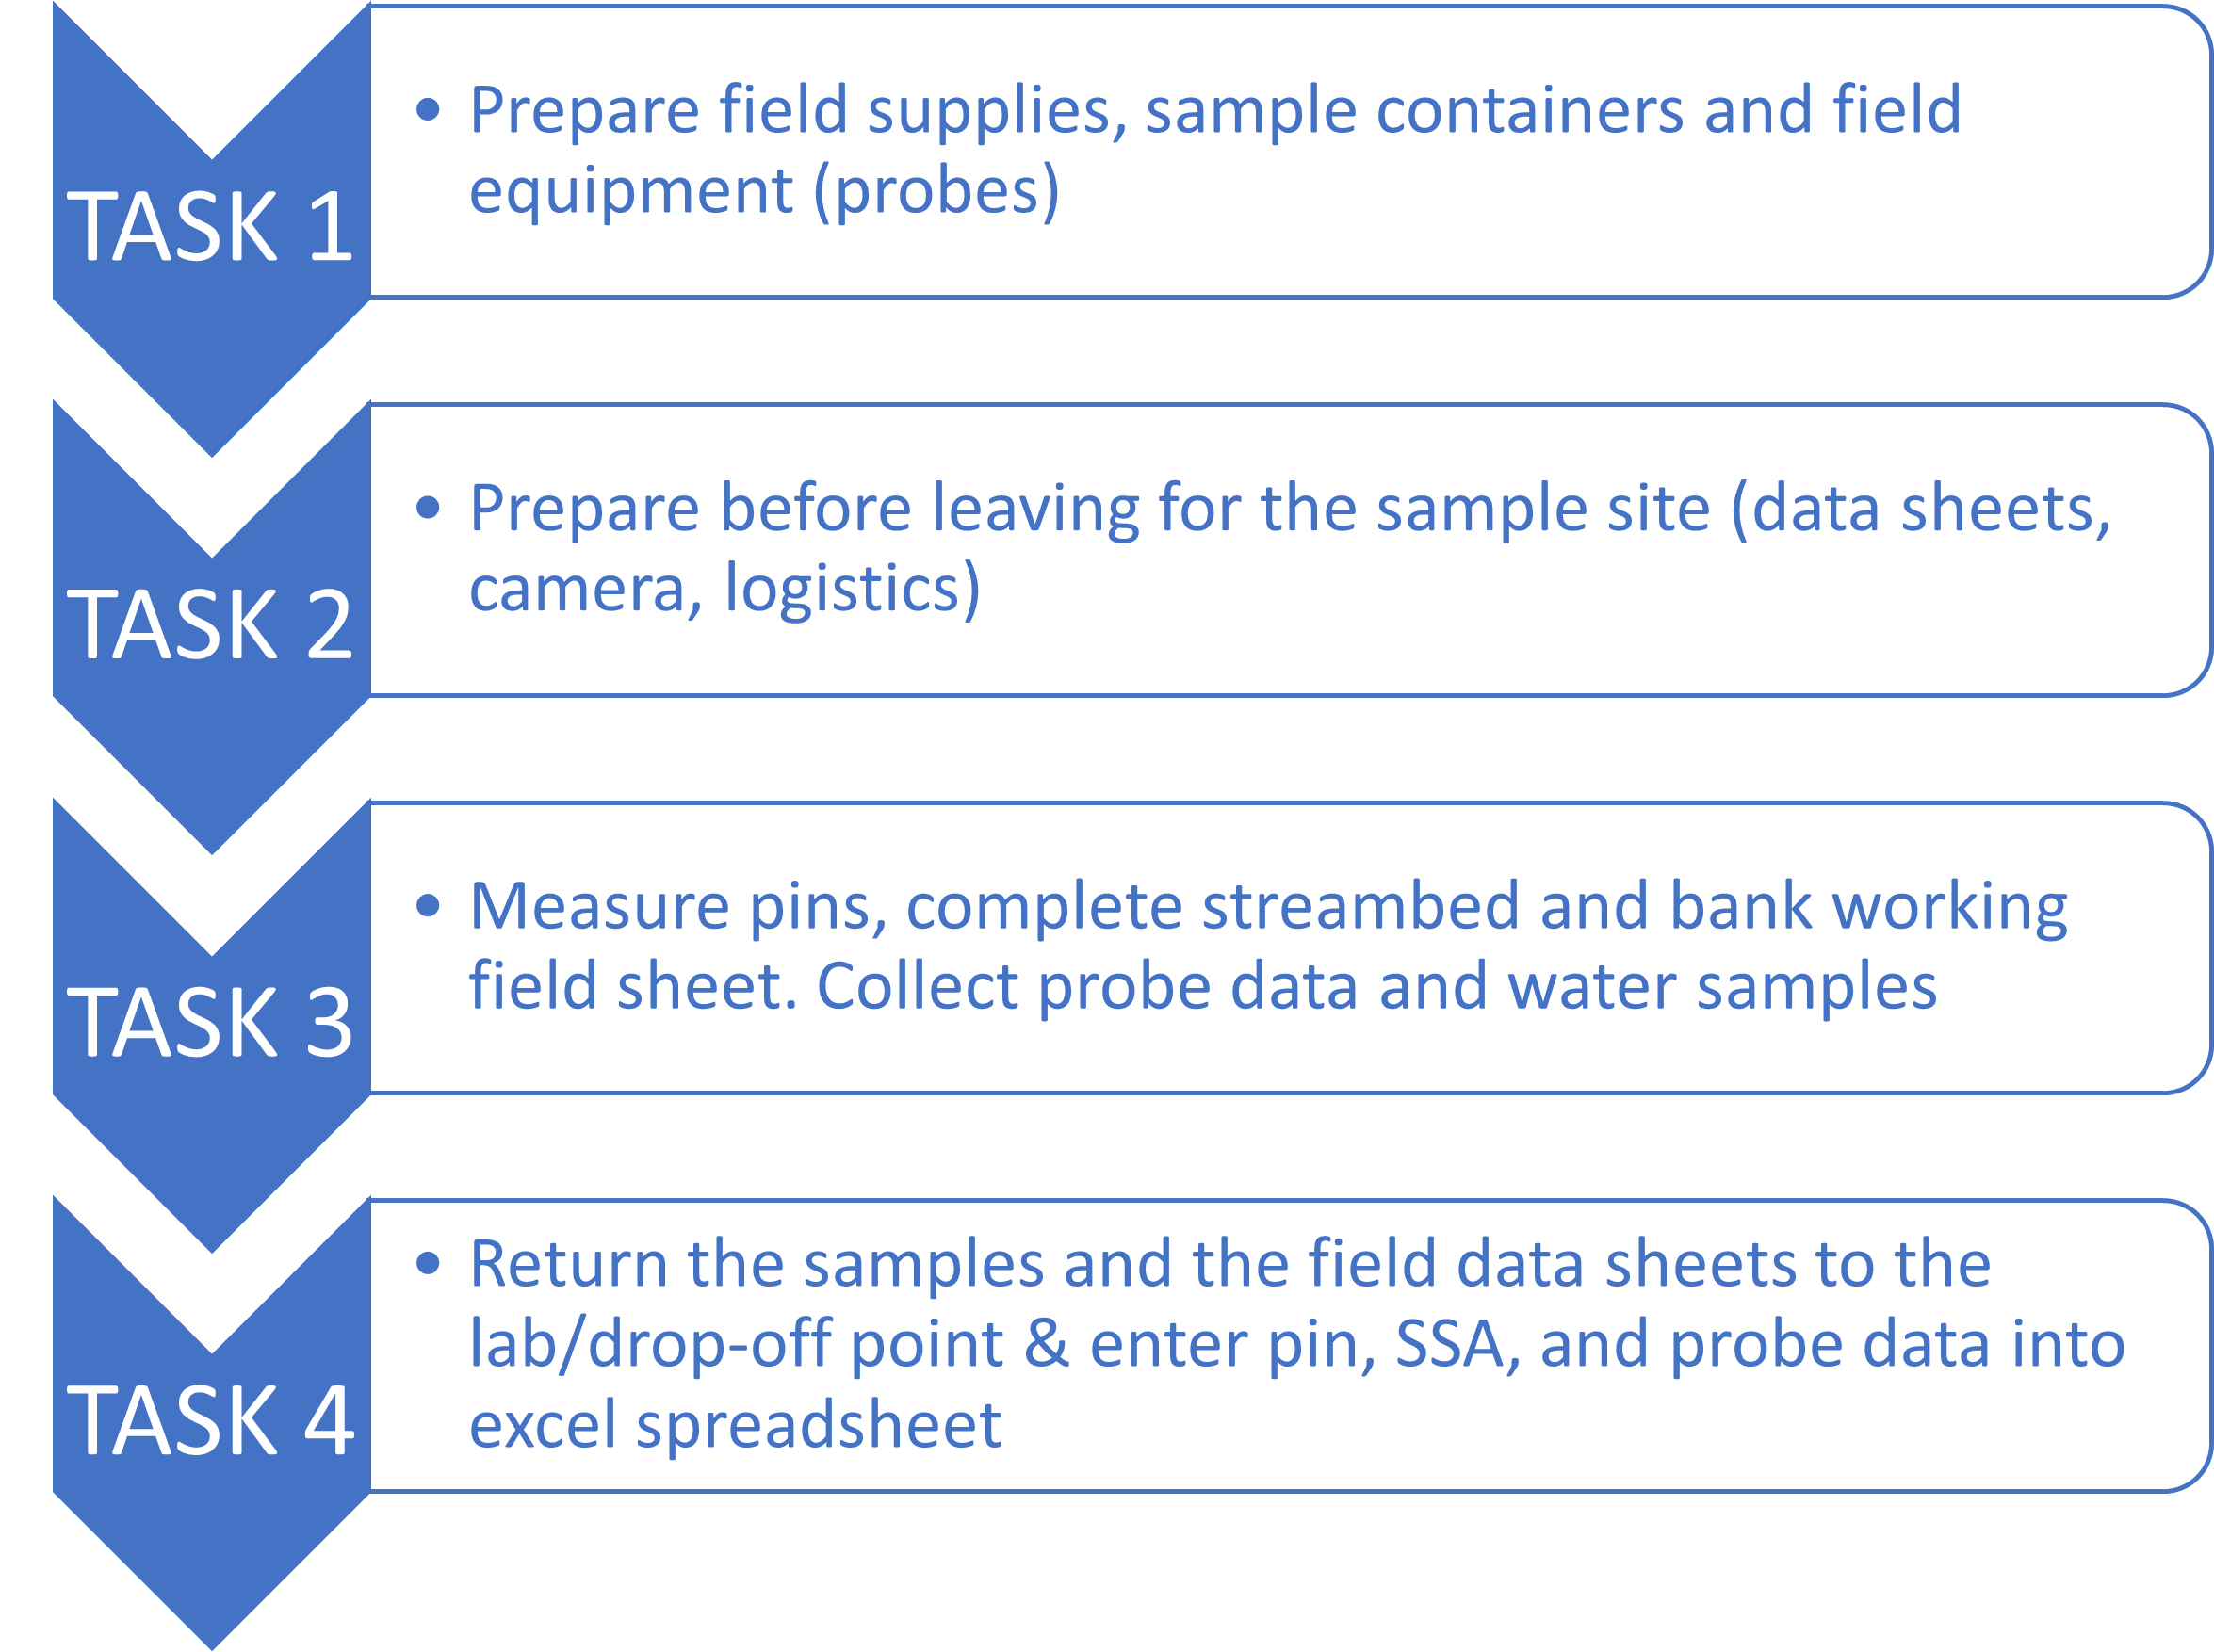
Figure 3 Basic tasks for a successful field day to characterize nutrient concentrations in water samples