Water Quality Streambank erosion
Wednesday, May 18, 2022 5:49 AMMethod description: Stream bank erosion
Stream bank erosion is usually quantified by assessing streambank erosion rate. The simplest, cheapest, and probably the most popular technique for measuring stream bank erosion is the erosion pin method consisting of inserting metal rods horizontally to the stream bank and leaving approximately 10 cm protruding from the stream bank. Other more sophisticated methods exist and can be learned here.
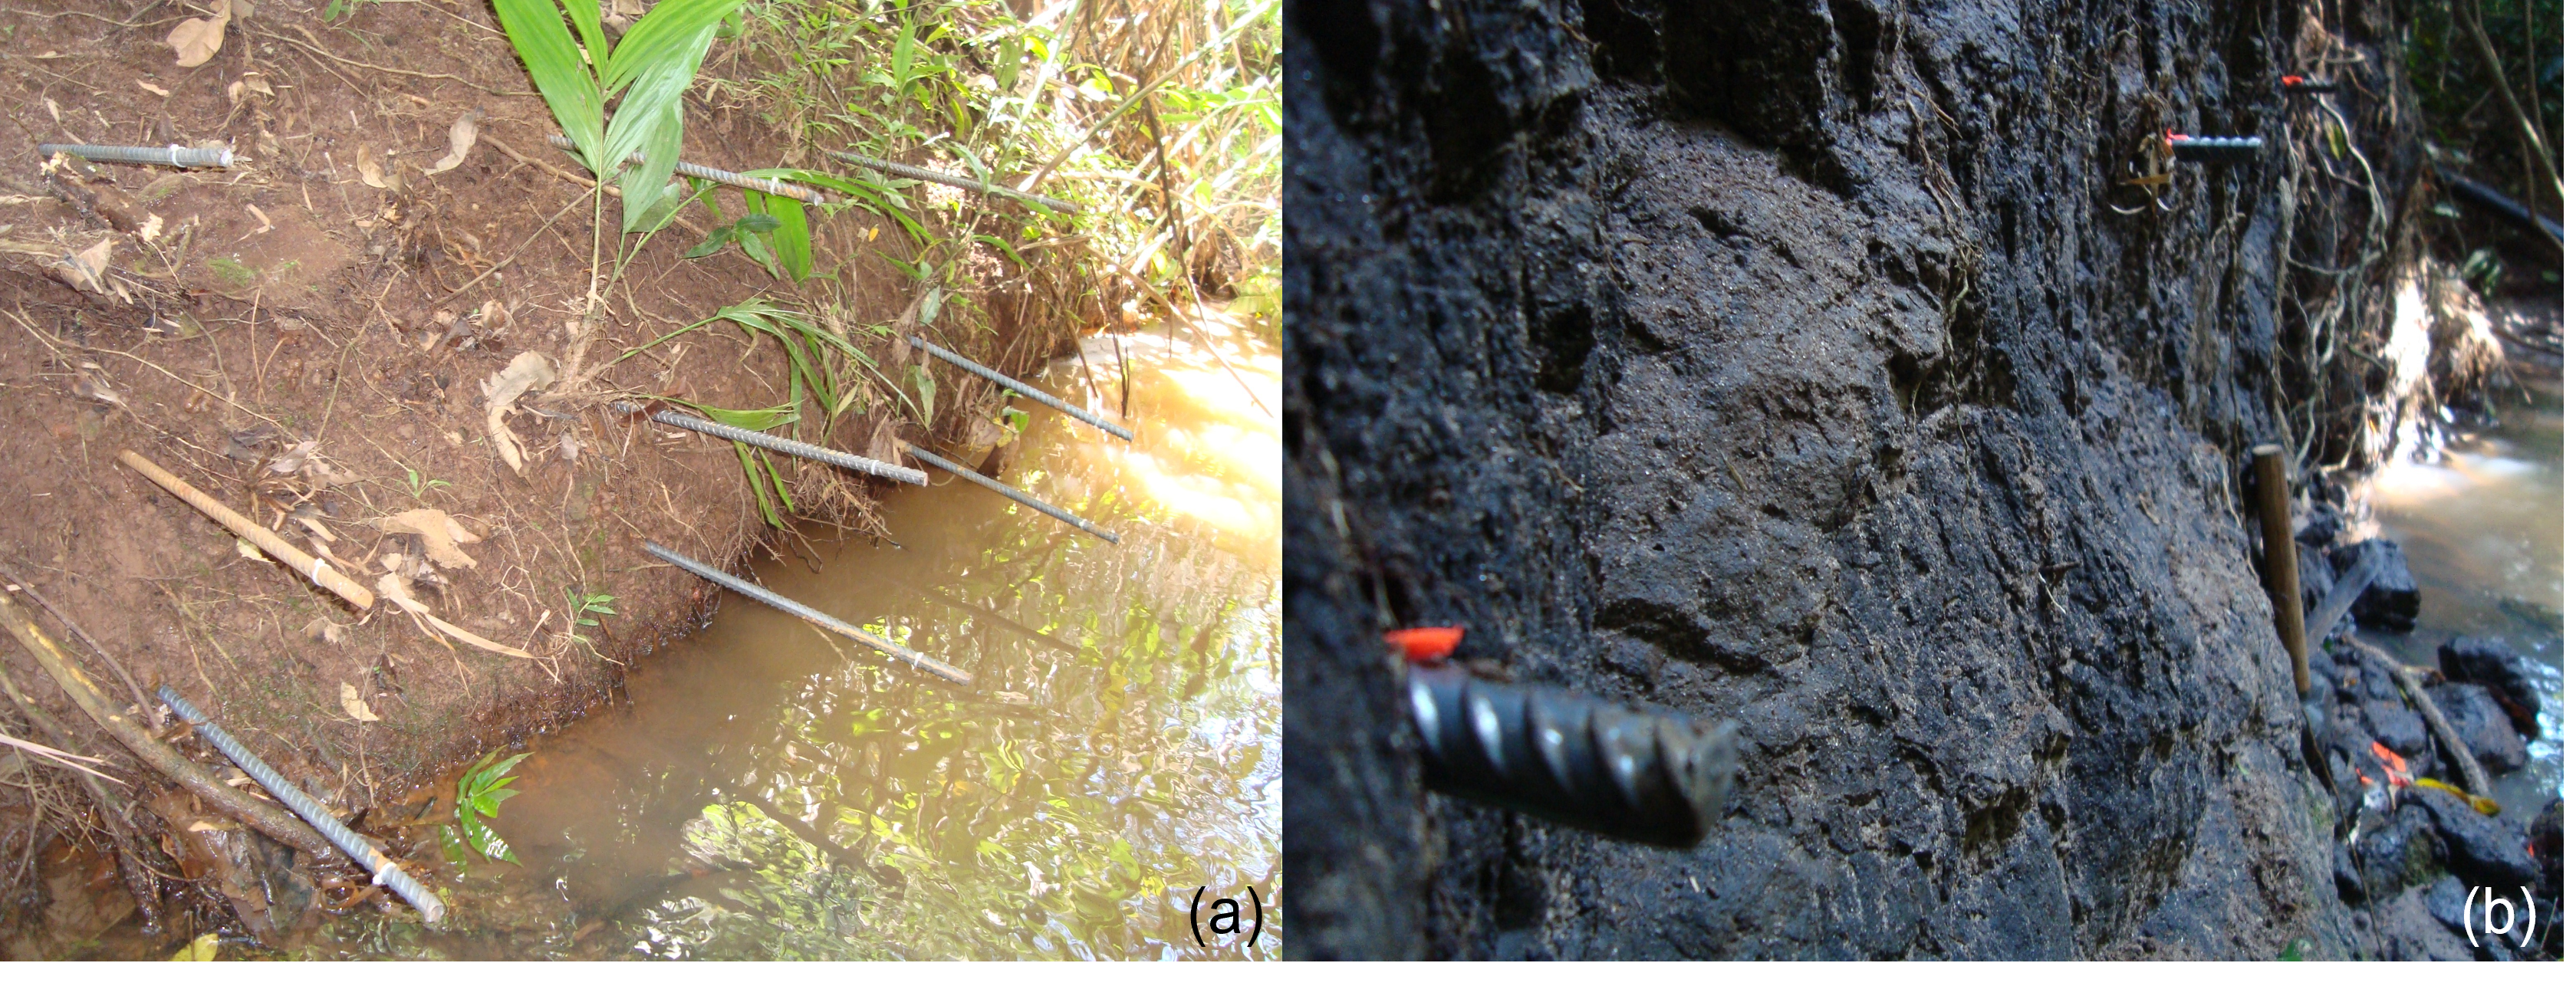
Figure 1 Example of erosion pins along a bank profile before being completed inserted (a) after complete insertion (b) – Photos © Maíra Ometto Bezerra.
Sampling design
The monitoring objectives and the intervention type and configuration will determine the approximate location of the stream or river station.
Site-specific characteristics must also be considered to ensure a successful project. Physical constraints of a site, the time required to reach the location, legal and physical access to a site and safety issues must be considered when making site selections.
The monitoring of stream bank erosion is conducted at the reach scale (any length of a stream or river with similar hydrology, Figure below).
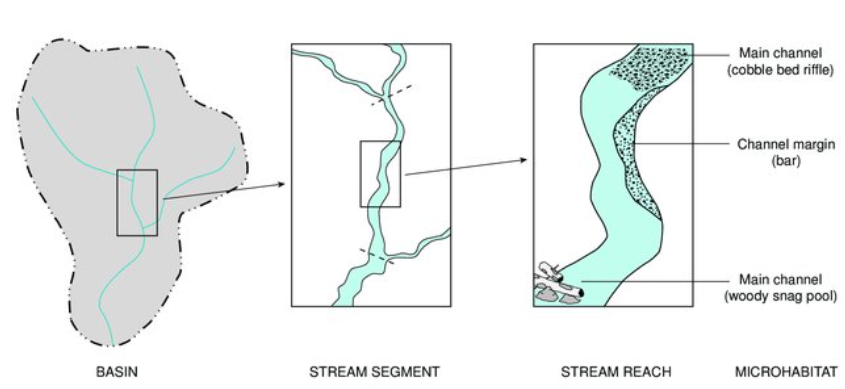
Figure 2 Spatial hierarchy of basin, stream segment, stream reach, and microhabitat (from Fitzpatrick et al. 1998)
Using terminology provided in Figure 2 above, the minimum sampling design to provide a complete view of bank erosion along a stream network includes: one cross section and longitudinal profile per stream reach. Three stream reaches per stream segment, and three segments per stream.
In each cross section, erosion pins are installed in quadrants of 9 pins, being 3 pins per elevation (low, middle, high, Figure below). Rebar benchmarks can be installed on either side of the channel cross-sections as reference points and the location of these benchmarks was estimated with GPS.
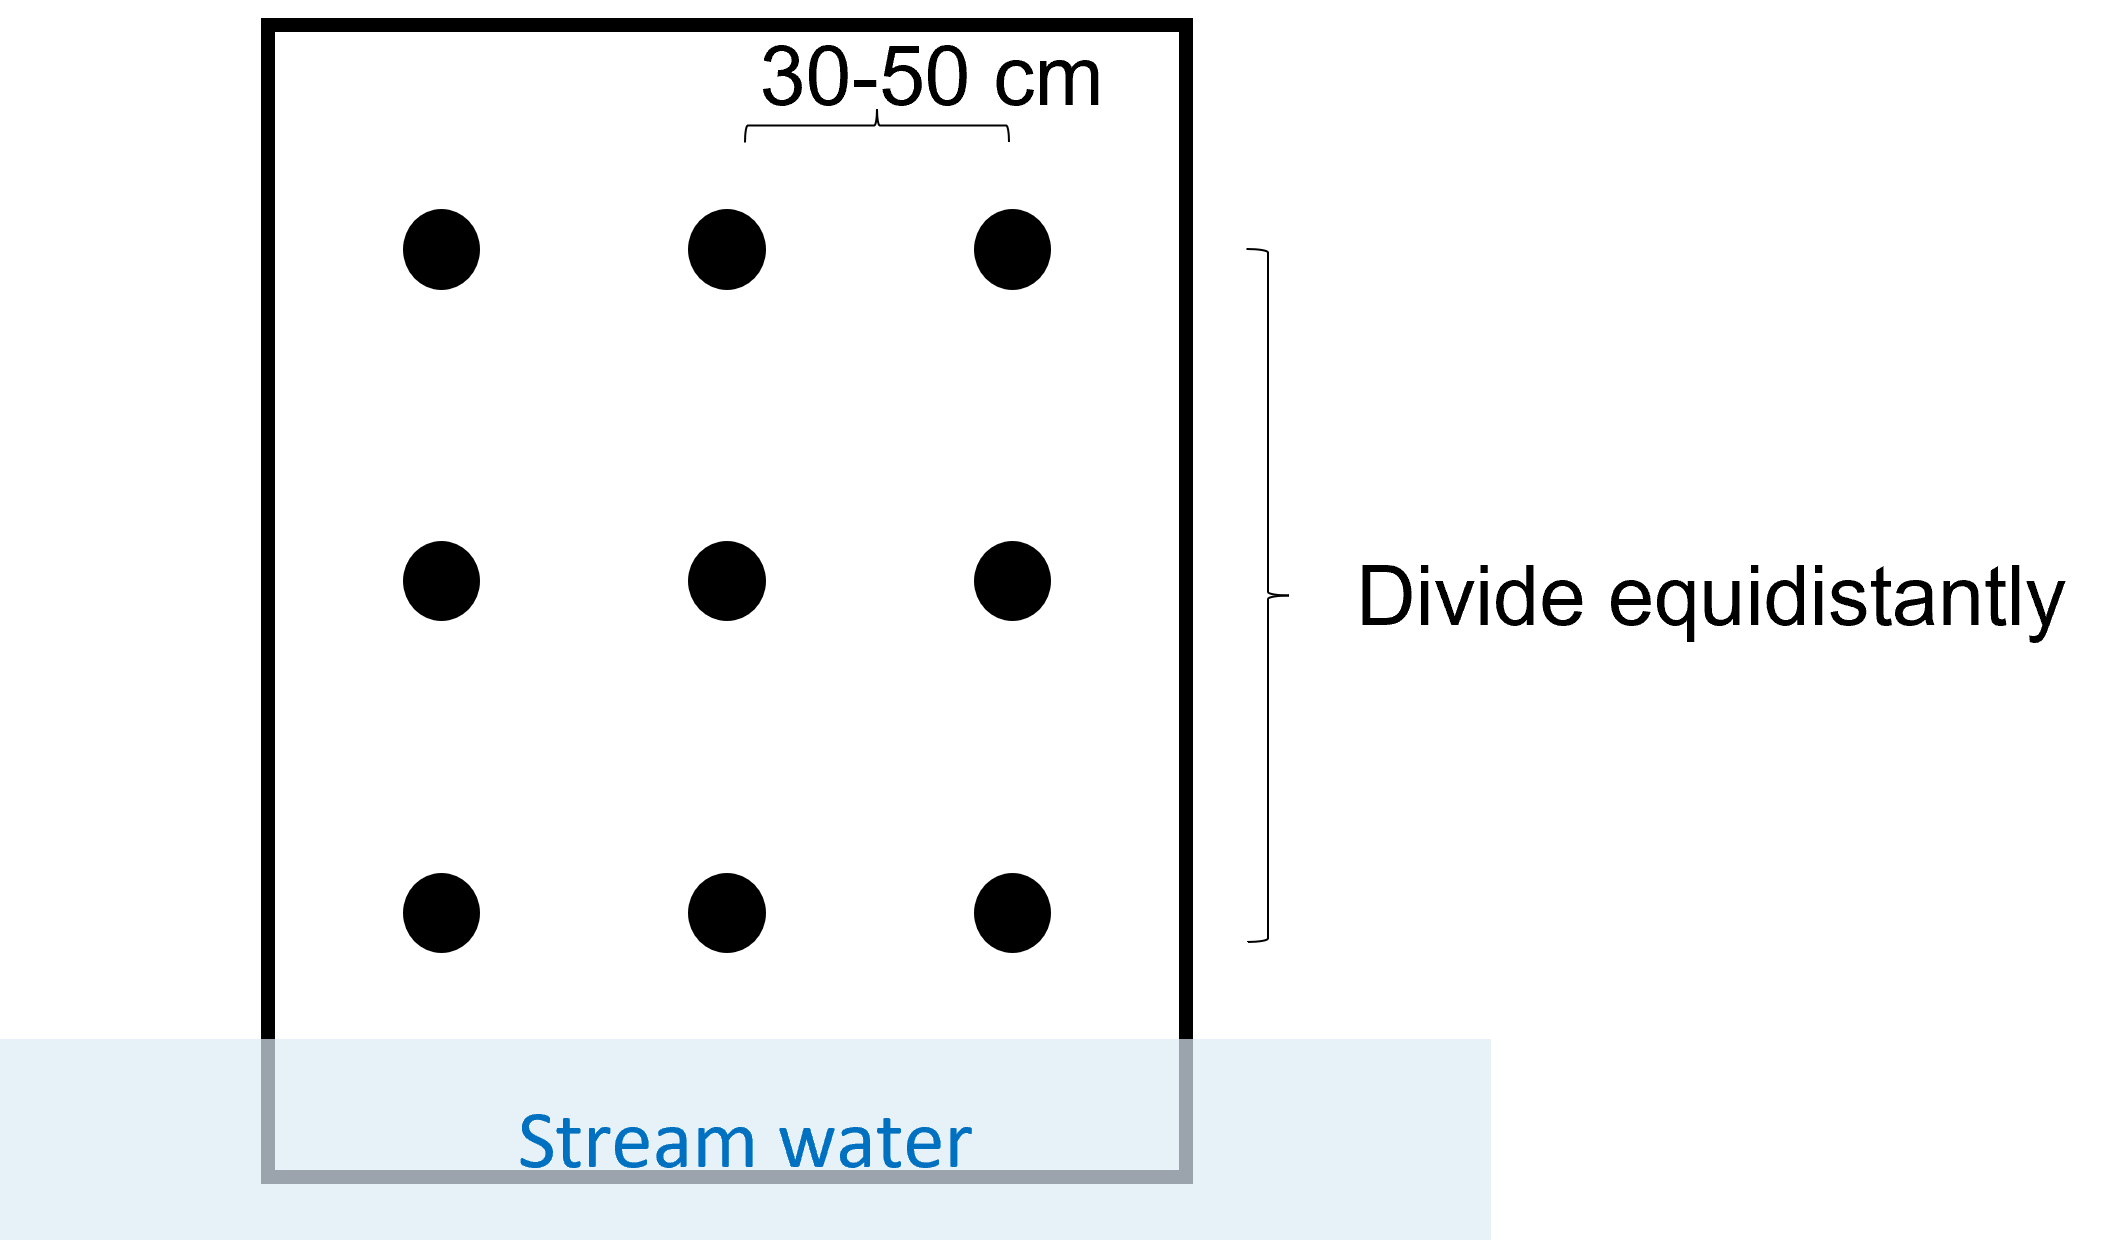
Figure 3 Diagram of erosion pin setup
Surveys are conducted once per year. Yearly surveys provide data for longitudinal assessments of bank retreat. For finer scale description of bank retreat, to characterize for example the correlation between erosive power of varying storm events, surveys can be conducted after storm events with differing intensities (at least 3 per year).
Quantification method to assess stream bank erosion
After storm events, practitioner measures the length by which the pin is exposed (bank retreat) using a digital depth gauge or metal ruler according the to the figure below. Relations are then empirically derived to quantify annual streambank erosion rates.
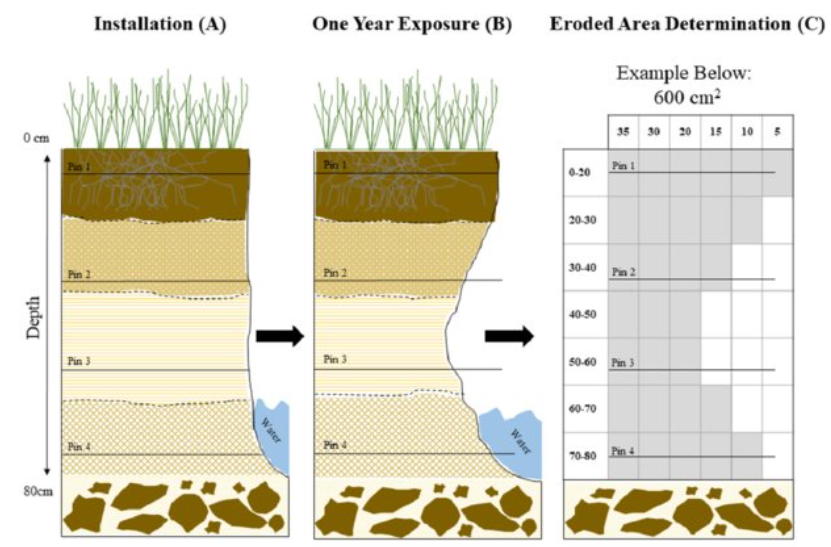
Figure 4 Schematic example of erosion pin profiles and estimation of bank retreat from erosion pins (from Martin et al. 2019)
Main costs
Main costs are provided in the table below. As an example, 81 erosion pins would be needed to monitor one stream using the sampling designed described above. Such design would allow for instance the monitoring of a stream where the entire length of the riparian zone have been restored (e.g., reforestation with native species or forest regrowth).
Table 1. Main costs to estimate stream bank retreat using the erosion pin method
| Supply | Cost per unit (US$) | Cost to survey one stream (US$) |
|---|---|---|
| Metal rebar | 0.25 | 20.25 |
| Sledgehammer | 10.00 | 10.00 |
| 50-cm metal ruler | 5.00 | 5.00 |
| Digital depth gauge (high precision) | 20.00 | 20.00 |
| TOTAL | 35.25 | 55.25 |
Preparation for a field day
The basic for steps to prepare for a field day to survey erosion pins.
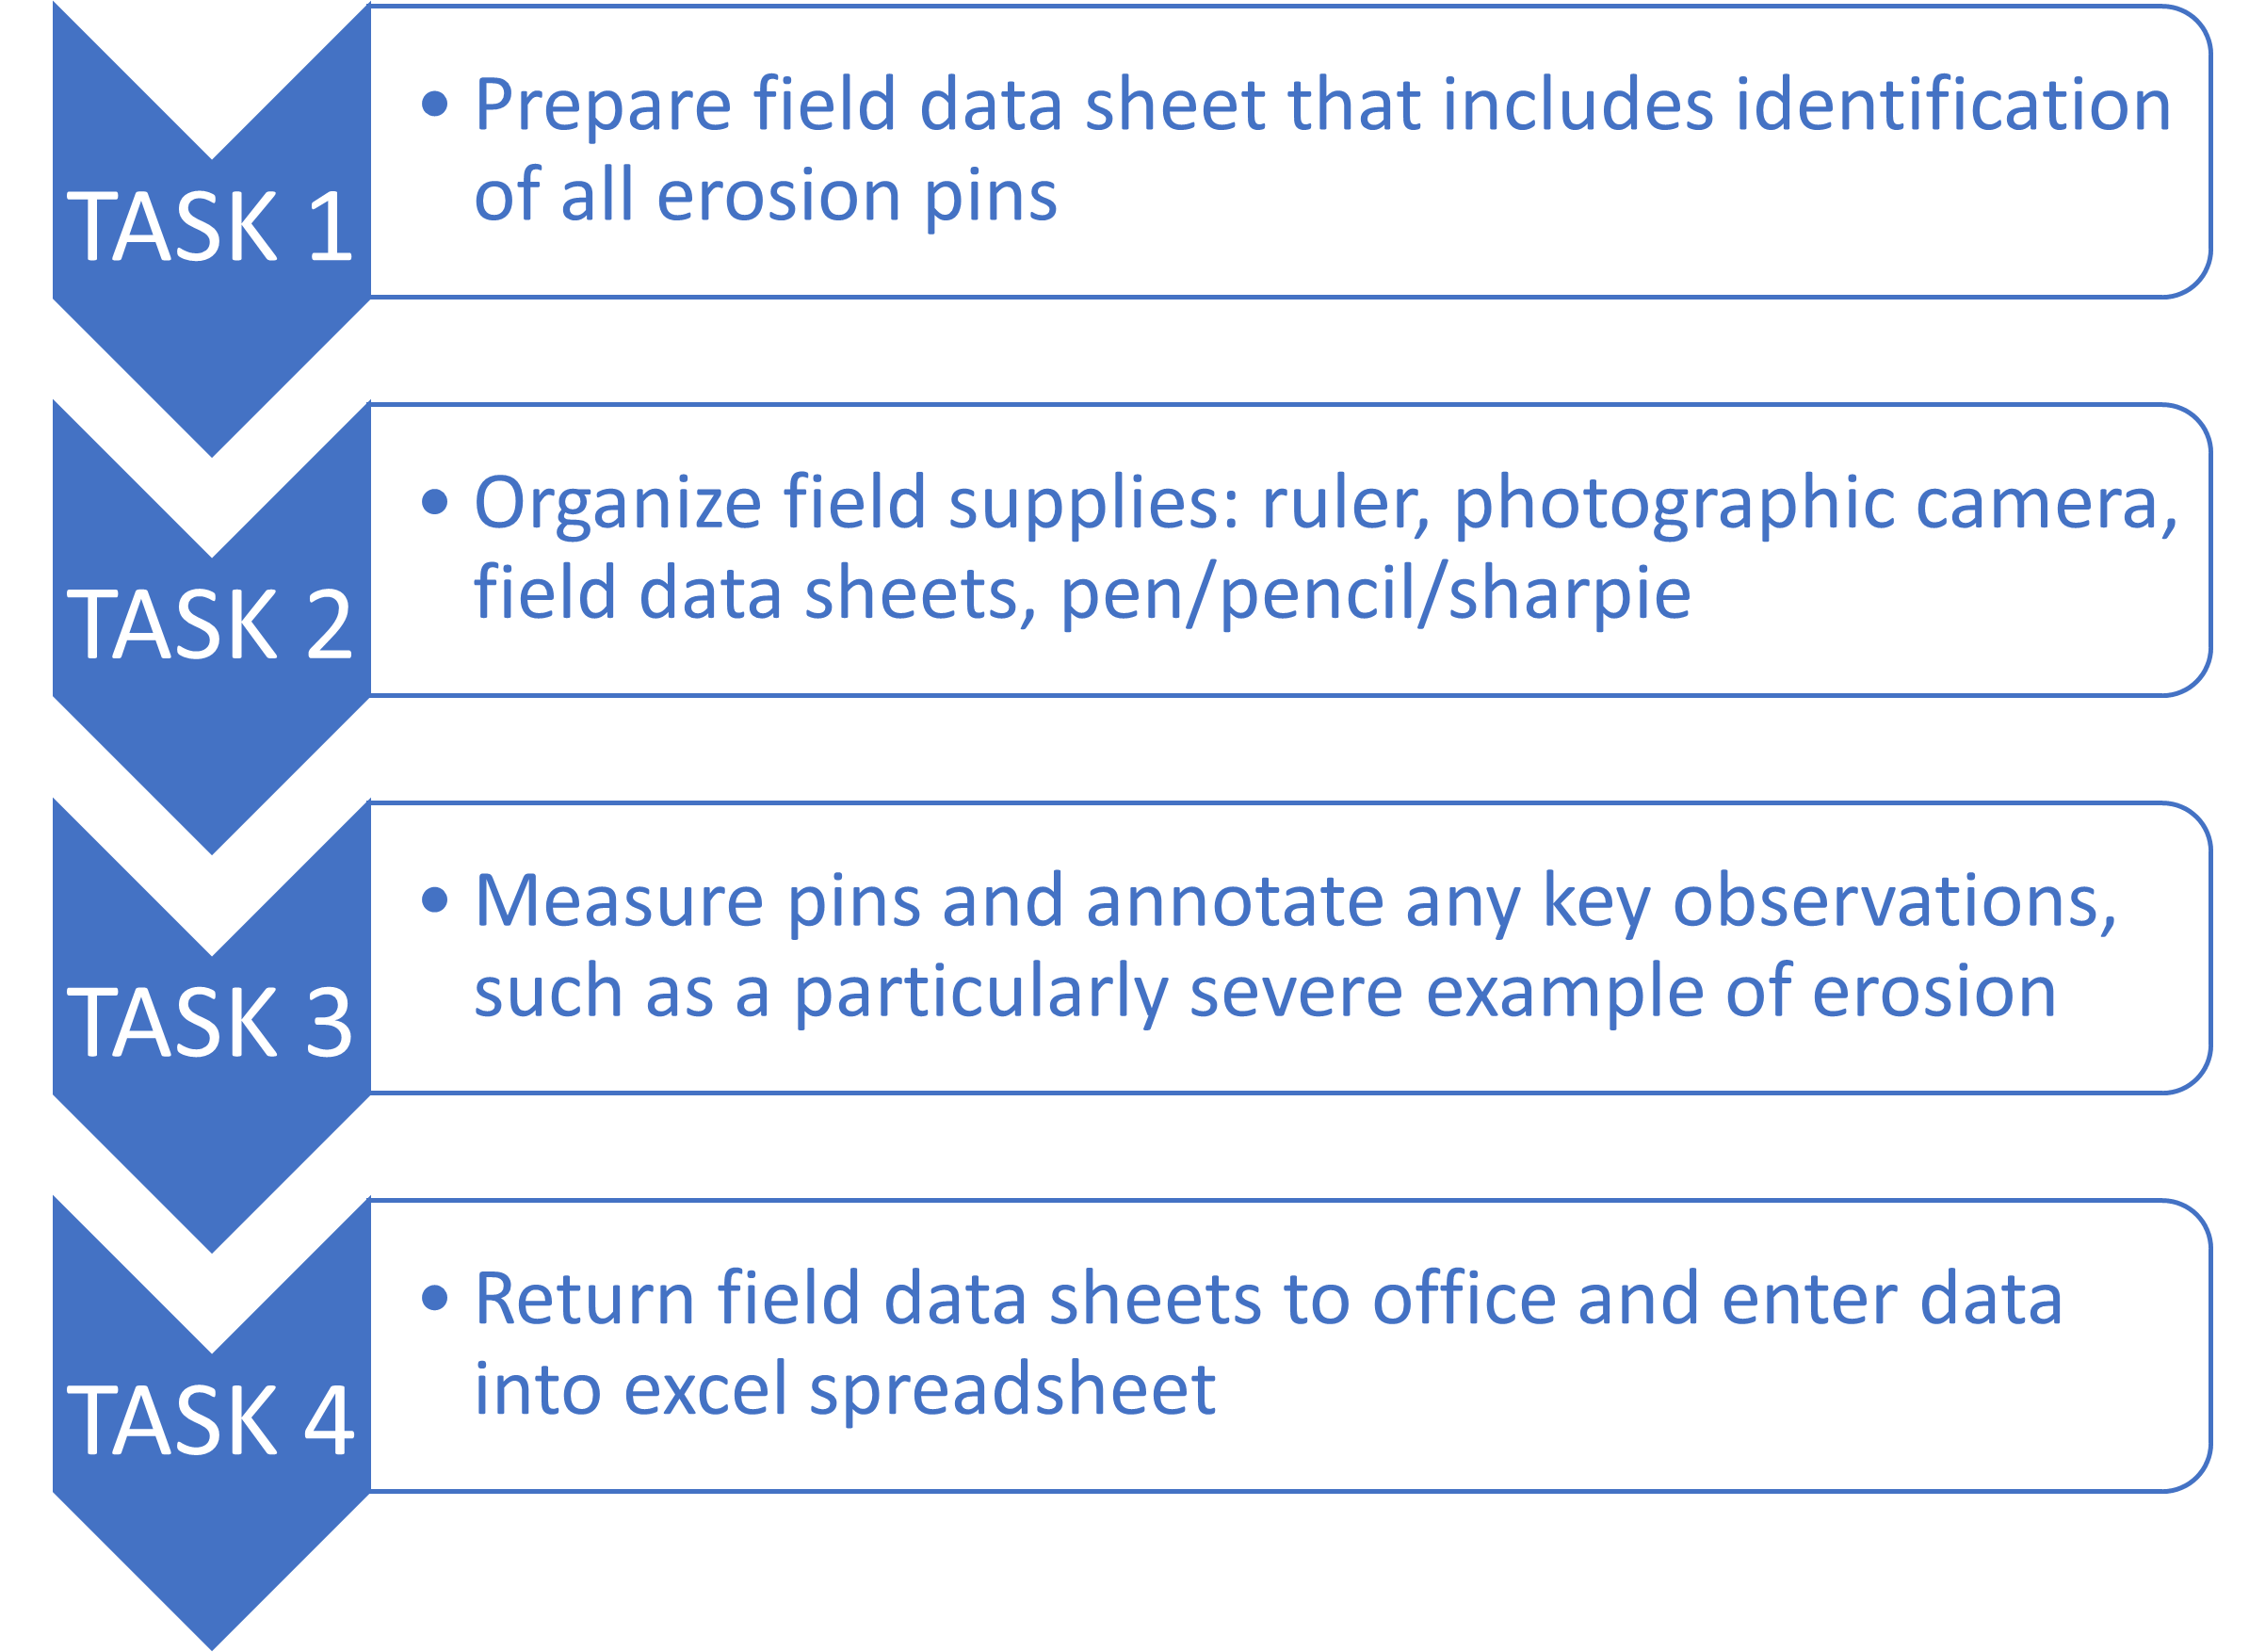
Figure 5 Basic tasks for a successful field day to characterize stream bank erosion